Research Highlights
Below is a list of items that have been shown on the CHPC homepage in the past.
| This page is deprecated. It is available as an archive of previously featured content, but it is not updated. More recent research highlights can be found on the CHPC homepage. |
Air Quality Modeling at CHPC
By Utah Division of Air Quality and University of Utah
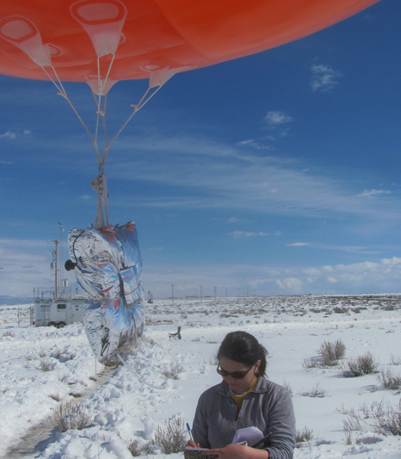
Collaboration between the Utah Division of Air Quality (UDAQ) and the University of Utah’s Center for High Performance Computing (CHPC) now gives the air quality modeling group at UDAQ access to advanced computing resources. This cooperative agreement began with a request from the Utah office of the Bureau of Land Management (BLM) for consultation on air quality modeling to support environmental impact analysis needed to process natural gas drilling permits in the Uintah Basin. This collaboration between UDAQ and CHPC is now a critical element in UDAQ’s ability to conduct air quality modeling for a wide variety of applications throughout the state, from the urbanized Wasatch Front to energy production areas of the Uintah Basin.
Mapping the Universe with CHPC Resources
By Joel Brownstein, Kyle Dawson, Gail Zasowski
Department of Physics and Astronomy, University of Utah
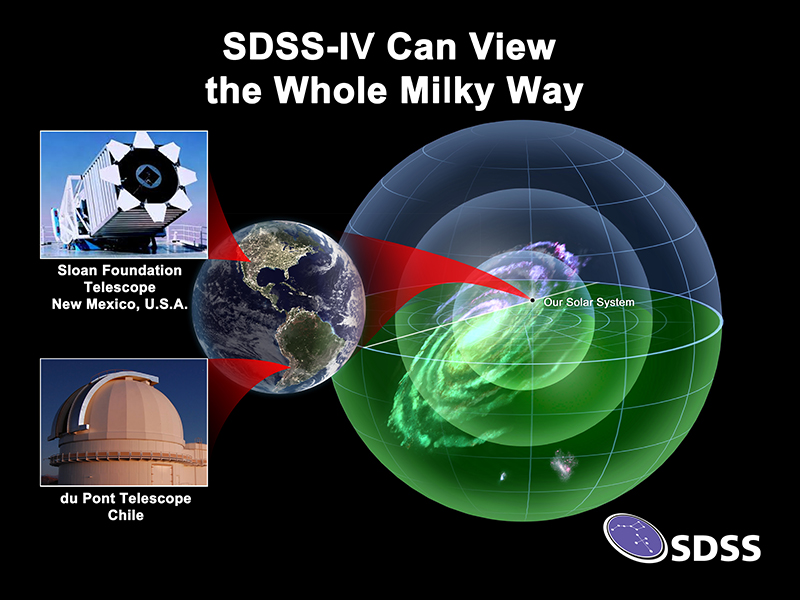
The Sloan Digital Sky Survey makes use of the University of Utah's Center for High Performance Computing (CHPC) parallel computing resources to help with its mission to map the Universe, from our Solar System through the Milky Way Galaxy, and beyond. Building on fifteen years of discovery, the fourth phase of SDSS (SDSS-IV) recently had two public data releases including DR14 earlier this year.
In SDSS-IV the survey expands its reach in three different ways:
- We observe a million stars in both the Northern and Southern skies by including a second telescope in Chile. SDSS now uses both the 2.5m Sloan telescope in New Mexico, and the 2.5m du Pont Telescope in Las Campanas, Chile.
- We observe millions of galaxies and quasars at previously unexplored distances to map the large-scale structure in the Universe 5 billion years ago, and to understand the nature of Dark Energy.
- We use new instrumentation to collect multiple high-resolution spectra within 10,000 nearby galaxies, to discover how galaxies grow and evolve over billions of years of cosmic history.
University of Utah astronomers are a core part of this international collaboration. Joel Brownstein, Professor of Physics and Astronomy, is the Principal Data Scientist, making sure that the SDSS data reduction pipelines run smoothly, and that the data products are easily accessible both within the team and publicly. Professor Kyle Dawson and postdoctoral fellows are also involved, working on instrumentation to map the distant Universe. Professor Gail Zasowski and her research group use SDSS observations of stars within our home Milky Way Galaxy to understand when and how they formed, and how our Galaxy is changing over time.

Autism Research within CHPC’s Protected Environment
By Deborah Bilder, M.D., William McMahon, M.D.
Department of Psychiatry, University of Utah
The Utah Autism and Developmental Disabilities Monitoring Project (UT-ADDM) headed by Deborah Bilder, M.D. and William McMahon, M.D. in the Department of Psychiatry at the University of Utah’s School of Medicine, uses CHPC’s robust protected environment that allows researchers using protected health information (PHI) to gather, process and store data, increasing user productivity and compliance. In addition to access to high performance computing power, other tangible benefits for researchers using PHI is that the CHPC handles systems management issues, such as rapid response to electrical power issues, provision of reliable cooling and heating, VPN support for a work-anywhere computing experience, and ensuring a hardened, secure environment compared to office computers or departmental servers. For the institution this resource allows much better compliance and reduces the vulnerabilities of exposure of PHI data.

Turning Weather and Climate Research into Actionable Science
By Jon Meyer
Utah Climate Center, Department of Plants, Soils, and Climate, Utah State University
The Utah Climate Center, hosted by the College of Agriculture and Applied Sciences at Utah State University, serves a mission of weather and climate ‘research-to-operations’ (R2O). Within the backdrop of changing climate, the R2O initiative is meant to help facilitate academic endeavors that are focused on actionable science products. R2O is well suited to address the dynamic and ever-changing suite of climate service needs at the state and federal level.
Compute nodes on the NOTCHPEAK partition are employed by the Utah Climate Center to handle the collection of automated software platforms designed to perform external data ingestion and processing or run computationally intensive real-time operational forecast modeling. In the face of the recent extreme drought, the Utah Climate Center has focused on building a comprehensive Utah Drought Dashboard to better monitor and assess drought conditions. This dashboard (viewable at https://climate.usu.edu/service/index.php) integrates numerous internal and external sources of weather and climate information into a ‘one stop shop’ website. CHPC resources have shouldered a great deal of the computational backend needed to monitor drought conditions, with the recent implementation of real-time soil moisture mapping being a major accomplishment. Each day, station data is downloaded and quality controlled. Final form data points are directed to the Utah Climate Center’s servers, where daily maps of soil moisture conditions are hosted. The figure shows an example of the color-coded daily soil moisture observations. Behind this daily soil moisture map is a process that involves CHPC software that tabulates hourly soil moisture observations from approximately 225 surface weather station locations.
In addition to data mining and processing, the Utah Climate Center also conducts real-time operational forecast modeling. While numerous forecast models are operated by NCEP, Utah’s complex terrain and intricate climate processes limit a great deal of forecast fidelity by the national models. CHPC resources allow the Utah Climate Center’s in-house modeling platforms to more closely focus on Utah’s highly nuanced weather patterns through a methodology called dynamic downscaling. Dynamic downscaling uses forecasted conditions from a coarse-resolution ‘parent’ forecast model to supply initial and boundary conditions for a higher resolution forecast domain placed inside the parent domain’s coverage. With complex terrain, the high resolution is especially important for Utah and leads to a much improved representation of weather and climate patterns.
For more information, see our Summer 2022 Newsletter.
Imaging Magma Reservoir beneath Yellowstone Park
By Fan-Chi Lin, Hsin-Hua Huang, Robert B. Smith, Jamie Farrell
Department of Geology & Geophysics, University of Utah
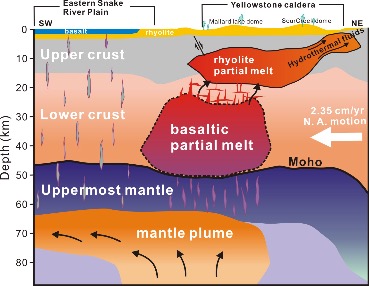
The supervolcano that lies beneath Yellowstone National Park is one of the world’s largest active volcanoes. University of Utah seismologists Fan-Chi Lin, Hsin-Hua Huang, Robert B. Smith and Jamie Farrell (Fan-Chi Lin group) have used advanced seismic imaging techniques to develop a more complete view of the magma chamber beneath this supervolcano, extending the known range from 12 miles underground to 28 miles. For the study the researchers used new methods to combine the seismic information from two sources. Data from local quakes and shallower crust were provided by University of Utah Seismographic Stations surrounding Yellowstone. Information on the deeper structures was provided by the NSF-funded EarthScope array of seismometers across the US.
Their recent study, as reported in the May 15, 2015 issue of Science, reveals that along with the previously known upper magma chamber there is also a second previously unknown second reservoir that is deeper and nearly 5 times larger than the upper chamber, as depicted in the cross-section illustration which cuts from the southwest to the northeast under Yellowstone. This study provides the first complete view of the plumbing system that supplies hot and partly molten rock from the Yellowstone hotspot to the Yellowstone supervolcano. Together these chambers have enough magma to fill the Grand Canyon nearly 14 times. Using resources at the Center for High Performance Computing, new 3D models are being developed to provide greater insight into the potential seismic and volcanic hazards presented by this supervolcano.
Computational Fluid Dynamic Simulation of a Novel Flash Ironmaking Technology
By Hong Yong Sohn
Department of Metallurgical Engineering, University of Utah
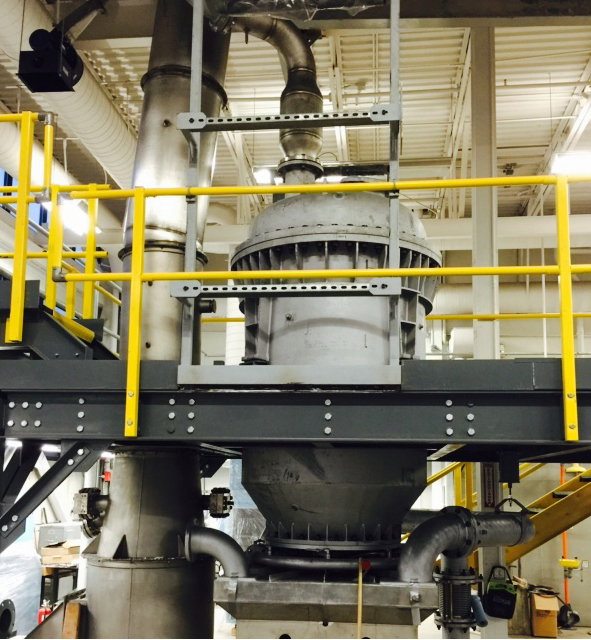
The U.S. steel industry needs a new technology that produces steel from iron ore with lower greenhouse gas emission and energy consumption. At the University of Utah, Prof. Hong Yong Sohn and his team have conceived of a drastically novel idea for an alternative method called the Flash Ironmaking Technology to replace the century-old blast furnace process. This new technology eliminates the highly problematic cokemaking and pelletization/sintering steps from the current ironmaking processes by directly utilizing iron ore concentrates, which are in abundance in the United States.
Using CHPC resources, the Sohn group is developing high-resolution computational fluid dynamics (CFD) simulations to select the optimal operating conditions for testing and subsequently reduce the testing time and effort. Simulation results will be used to analyze the results from the flash reactors. Also of high importance, the results of the simulations will assist in the subsequent design of an industrial-scale pilot facility and eventual full-scale commercial plant.
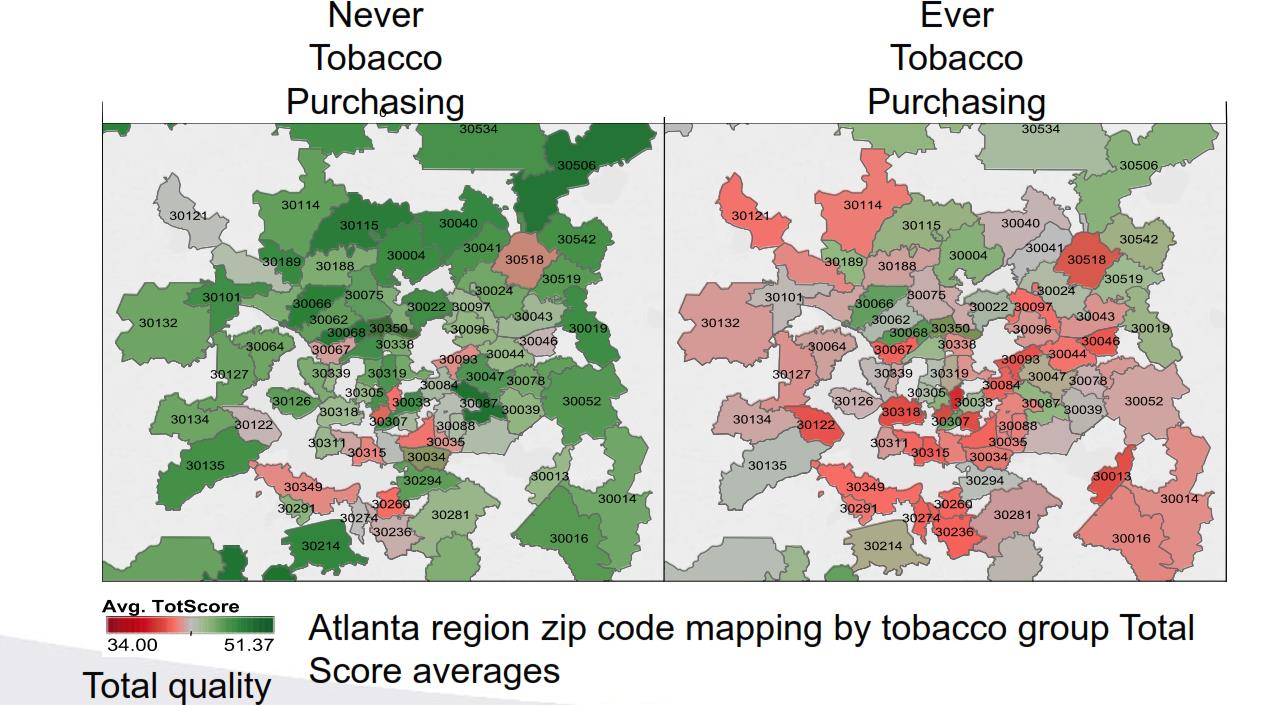
An Analysis of Tobacco and Food Purchases
By John Hurdle
Department of Biomedical Informatics, University of Utah
Professor John Hurdle, Biomedical Informatics, has developed QualMART, a tool for helping grocery stores promote healthy eating habits for their customers. To validate the effectiveness of this tool, the group conducted a study that compared tobacco purchases and the quality of food purchases. They classified household grocery transactions in the Atlanta region, based on whether shoppers had ever purchased tobacco, and then applied their novel food purchase quality scoring measure to evaluate the household food environment. The master database with 15 months’ shopping activity from over 100,000 households nationally is housed on a HIPAA-compliant cluster at CHPC (accessed via Swasey).
The graphic shows the difference between ‘ever’ and ‘never’ tobacco purchasing groups is significant, with green areas indicating higher food quality scores and grey and red showing lower quality scores, aggregated by the zip code of the grocery shopping location.
This study validated the group's data-driven grocery food quality scoring design as the findings reproduce results from other studies in the scientific literature showing that tobacco users have lower overall diet quality compared to people who do not use tobacco.
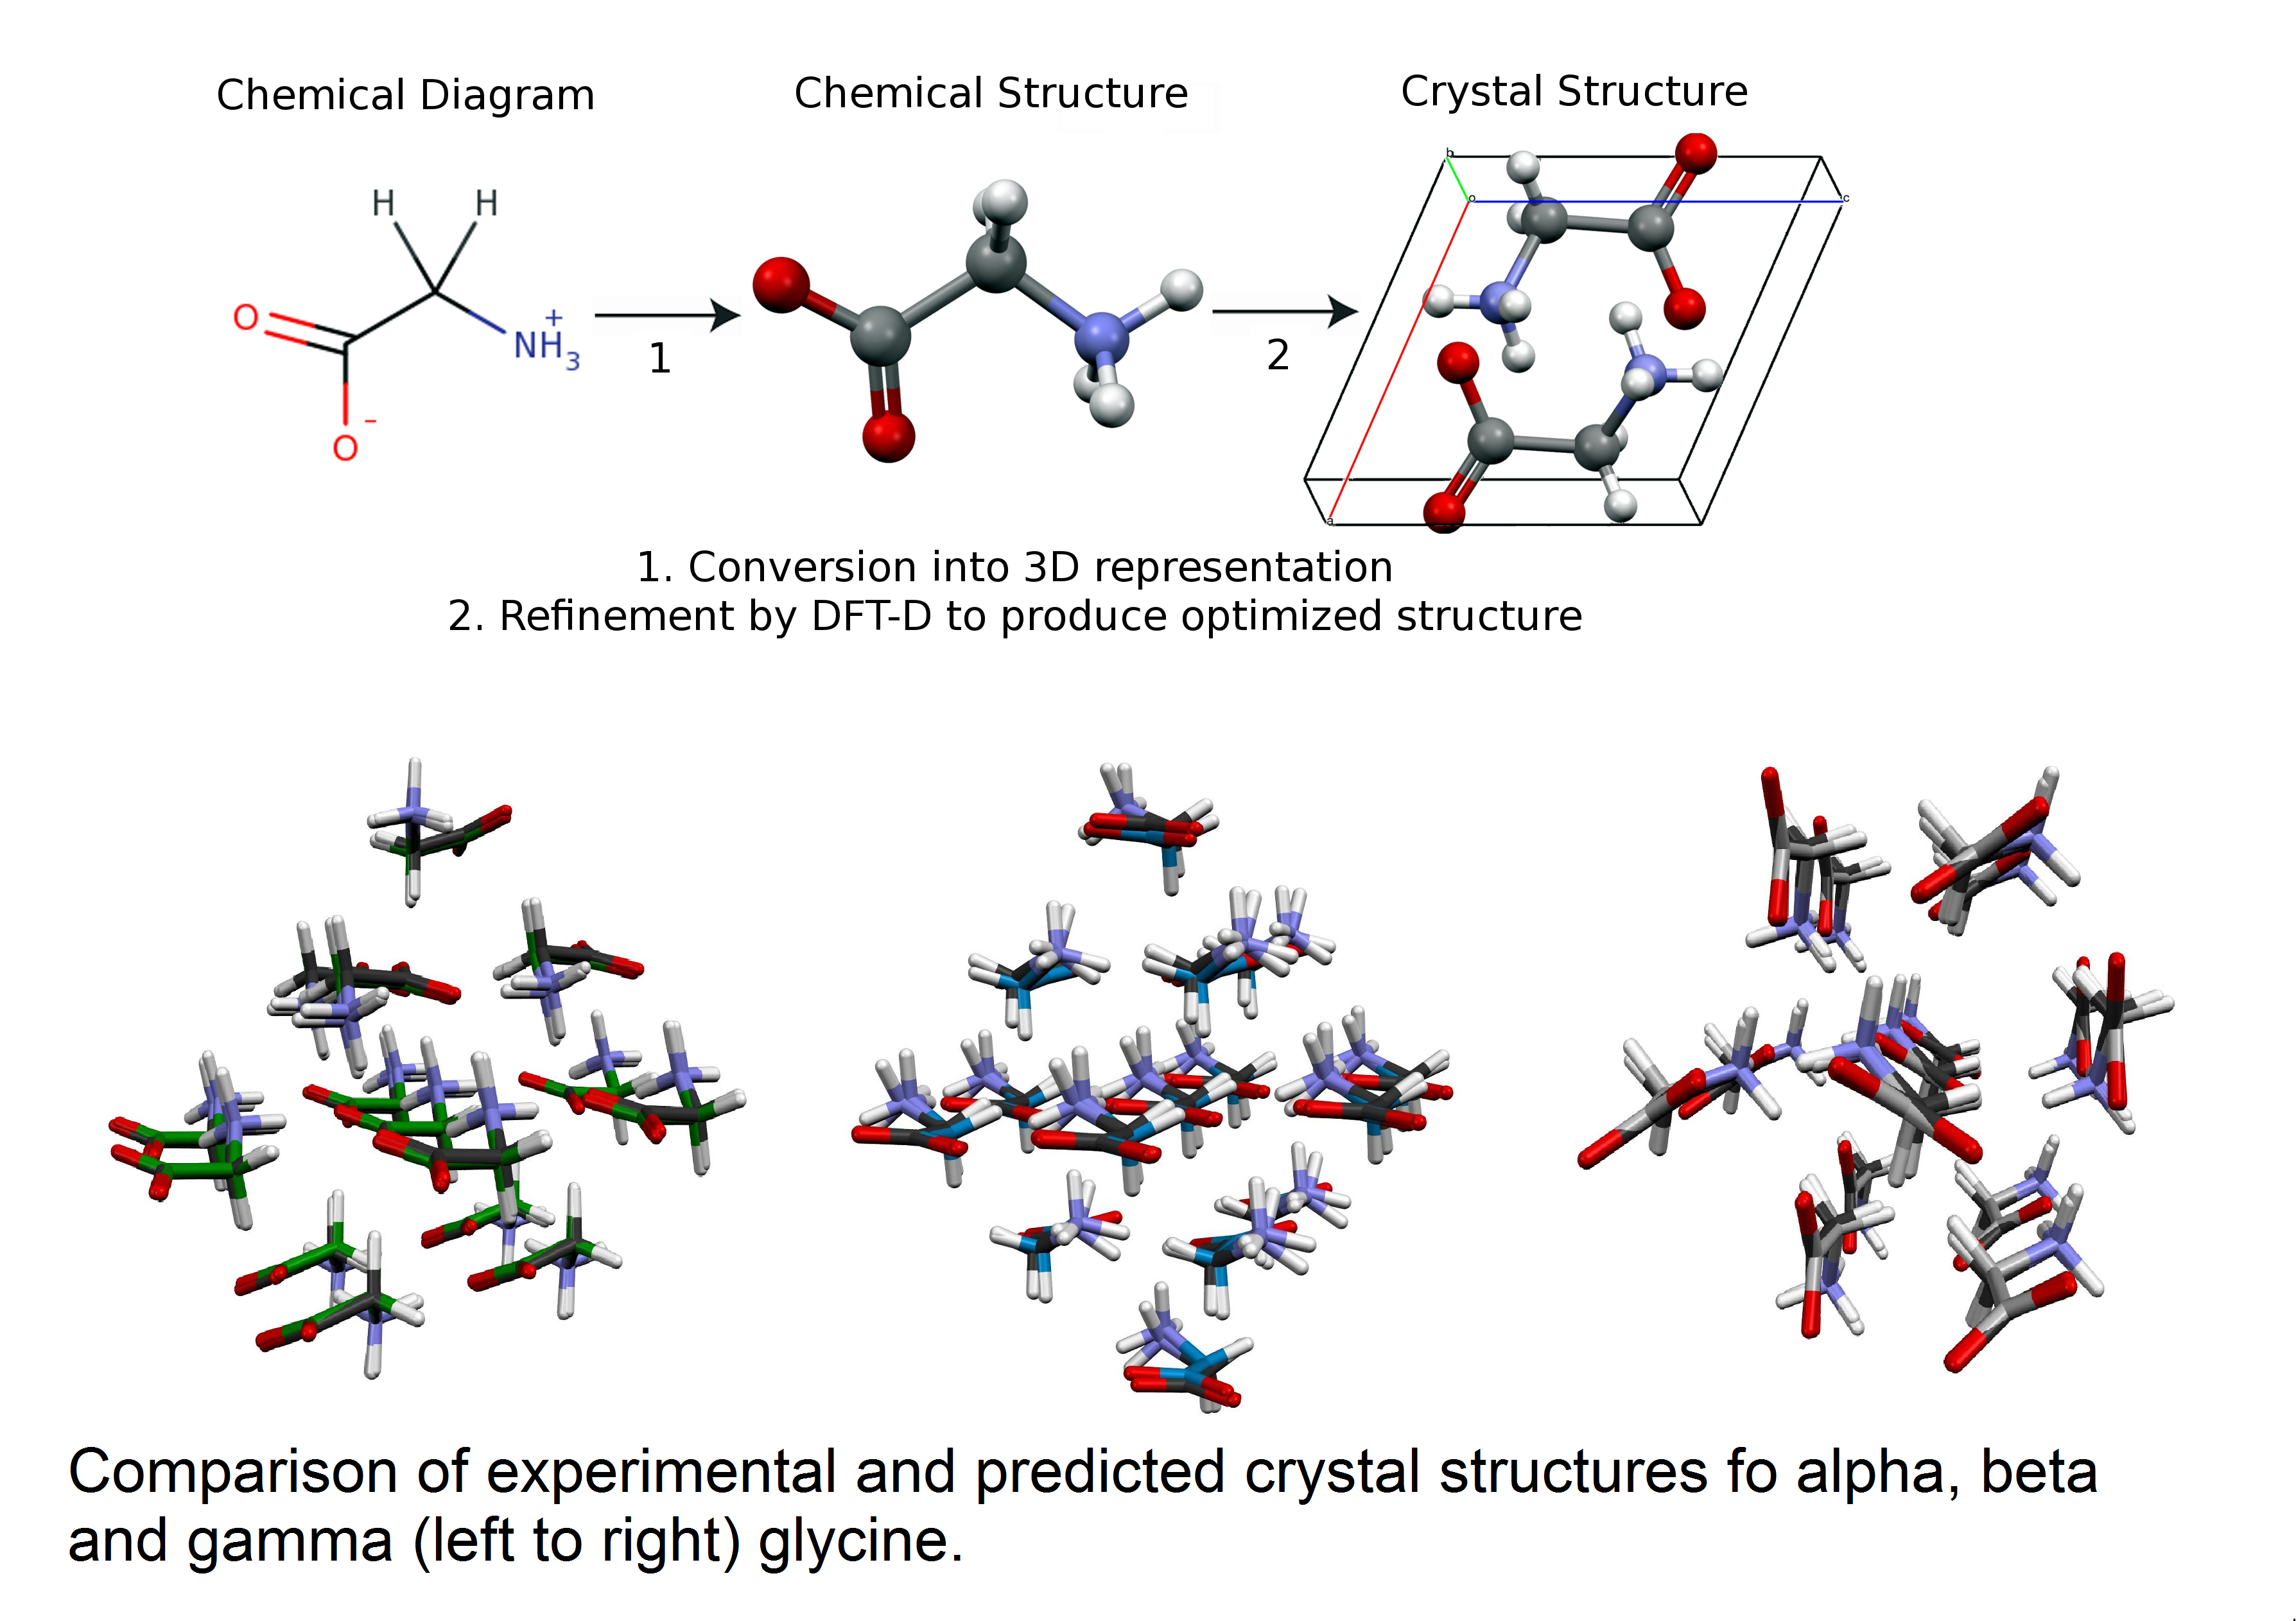
Prediction of Crystal Structures from First Principle Calculations
By Albert M. Lund1,2, Gabriel I. Pagola4, Anita M. Orendt2, Marta B. Ferraro4, and Julio C. Facelli2,3
1Department of Chemistry; 2Center for High Performance Computing; 3Department of Biomedical Informatics, University of Utah 4Departamento de Física and IFIBA (CONICET) Facultad de Ciencias Exactas y Naturales, University of Buenos Aires
Using CHPC resources, a team of researchers from the University of Utah and the University of Buenos Aires has demonstrated that it is possible to predict the crystal structures of a biomedical molecule using solely first principles calculations. The results on glycine polymorphs shown in the figure were obtained using the Genetic Algorithms search implemented in Modified Genetic Algorithm for Crystals coupled with the local optimization and energy evaluation provided by Quantum Espresso. All three of the ambient pressure stable glycine polymorphs were found in the same energetic ordering as observed experimentally. The agreement between the experimental and predicted structures is of such accuracy that they are visually almost indistinguishable.
The ability to accomplish this goal has far reaching implications well beyond just intellectual curiosity. Crystal structure prediction can be used to obtain an understanding of the principles that control crystal growth. More practically, the ability to successfully predict crystal structures and energetics based on computation alone will have a significant impact in many industries for which crystal structure and stability plays a critical role in product formulation and manufacturing, including pharmaceuticals, agrochemicals, pigments, dyes and explosives.
Read the article in Chemical Physics Letters.
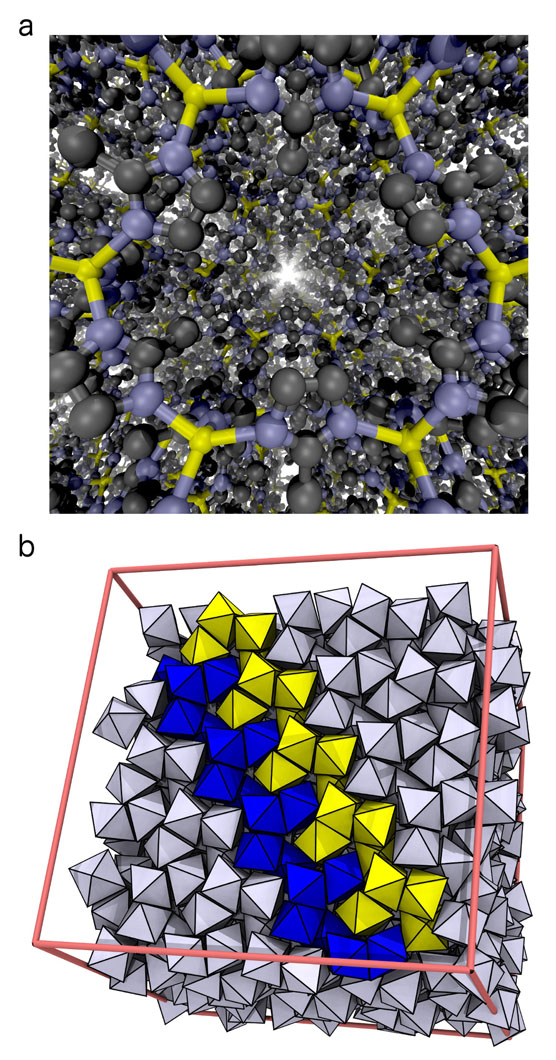
Watching Nanomaterials Assemble at CHPC
By Prof. Michael Grünwald
Grünwald Research Group, Department of Chemistry, University of Utah
My son and I like to build remote control cars. The path that leads from a disordered pile of plastic parts and metal screws to a new race car is straightforward and fun: step after step, we collect the pieces that need to be assembled and put them together according to the instructions. In fact, this assembly strategy is the blueprint for much human building activity and applies almost generally to the construction of houses, machines, furniture (in particular the Swedish kind), and many other objects of our daily lives.
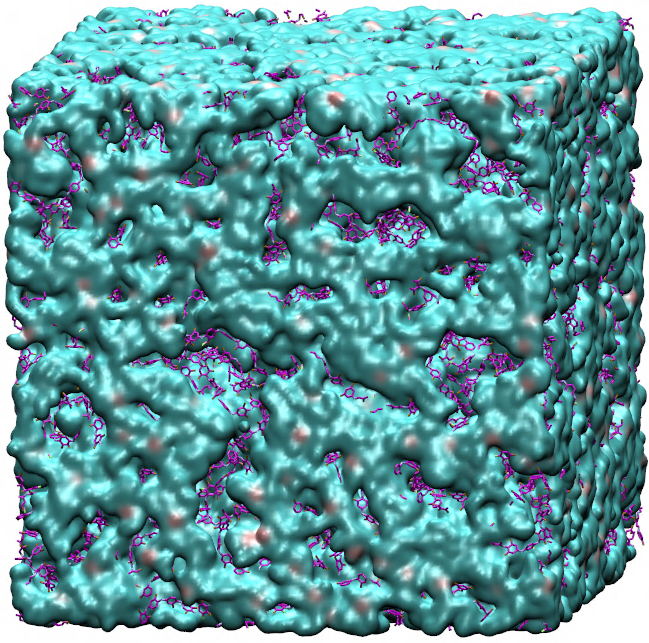
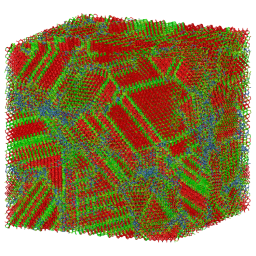
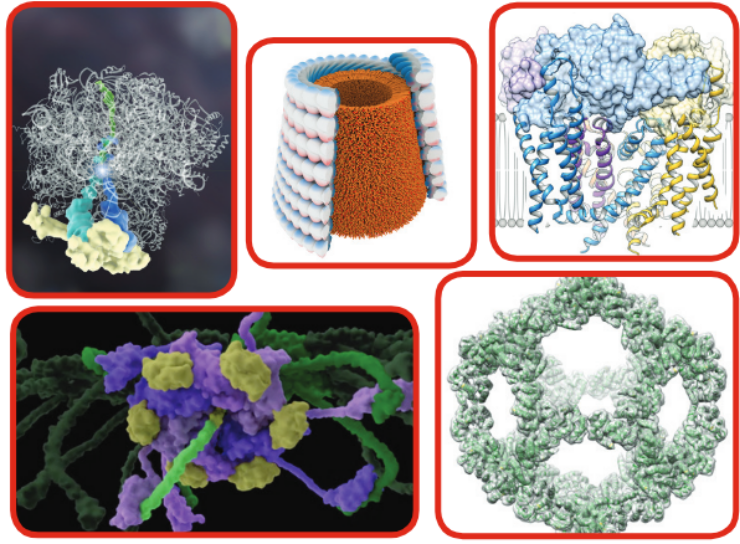
Large objects, that is. Building small things, as it turns out, requires a strikingly different approach. Consider, for instance, the "objects" illustrated in Figure 1: A porous crystal structure made from intricately arranged metal ions and organic molecules (a "metal-organic framework"), and an ordered arrangement of nanoparticles (a "superstructure"), which themselves consist of many thousands of atoms. These structures are examples of "nanomaterials", objects that derive their unusual properties from their fascinating microscopic structure. Because of their large pores, metal-organic frameworks like the one in Figure 1a can be used to store hydrogen gas, filter CO2, or separate molecules by shape. Depending on the kinds of nanoparticles used, superstructures such as the one in Figure 1b can be used to alter the direction of light, or act as new kinds of solar cells.
Read the full article in the newsletter.
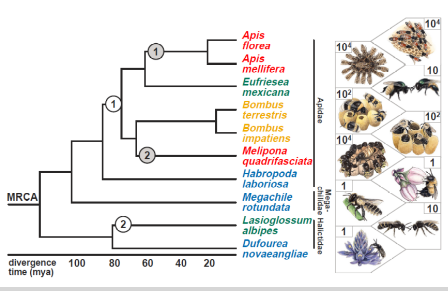
Genomic Insights Through Computation
By Karen Kapheim
Kapheim Lab, Utah State University

Understanding the Carbon Cycle Through Climate Models
By Brett Raczka
Department of Biology, University of Utah
Read the paper in Biogeosciences.
Tracking Pressure Features
By Alexander Jacques
MesoWest/SynopticLabs and Department of Atmospheric Sciences, University of Utah
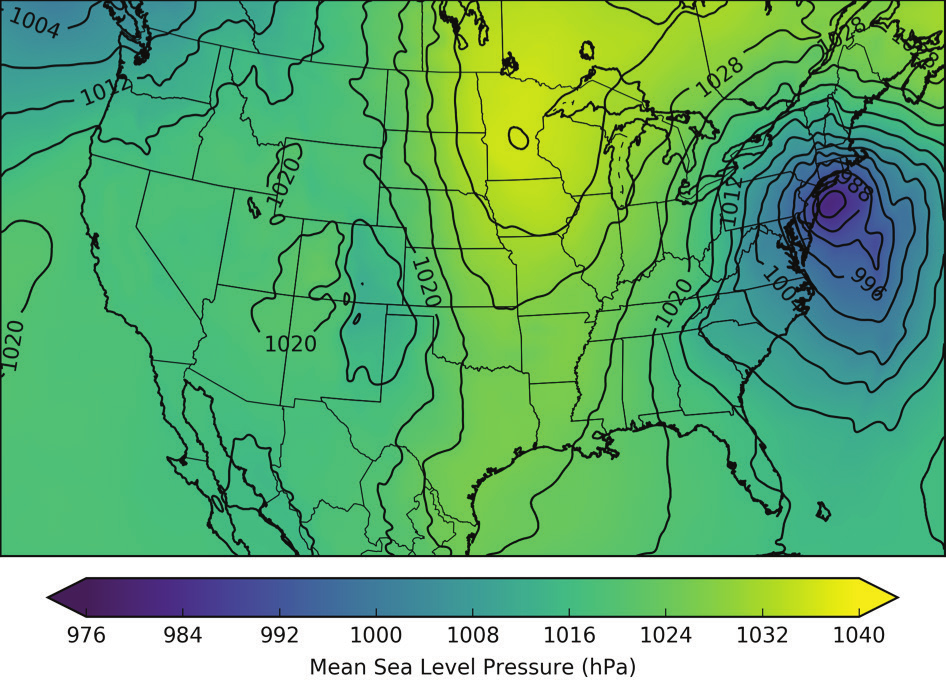
Center for High Performance Computing resources were used to model the progression of a mesoscale gravity wave generated by a large storm system on April 26–27, 2011.
A mesoscale gravity wave, generated by a large storm system in the southern United States, moved northward through the central United States causing short-term changes in surface wind speed and direction. This animation shows efforts to detect and evaluate the negative mesoscale surface pressure perturbation generated by this wave. Detected positive (red contours) and negative (blue contours) perturbations are determined from perturbation analysis grids, generated every 5 minutes, using USArray Transportable Array surface pressure observations (circle markers). Best-track paths for the perturbations are shown via the dotted trajectories. To identify physical phenomena associated with the perturbations, conventional radar imagery was also leveraged. It can be seen here that the detected feature migrates north away from the majority of the precipitation, which is often seen with mesoscale gravity wave features.
Modeling Ozone Concentration
By Brian Blaylock
Department of Atmospheric Sciences, University of Utah
Modeling the Unexpected Formation of a Gyroid
By Carlos Chu-Jon
Grünwald Research Group, Department of Chemistry, University of Utah
Changes in Neuronal Membrane Properties Lead to Suppression of Hippocampal Ripples
By Eric D. Melonakos1, John A. White1,2, and Fernando R. Fernandez1,2
1Department of Bioengineering; 2Department of Biomedical Engineering, Boston University
Center for High Performance Computing resources were used to study the effects of cholinergic inputs to the hippocampus on patterns of brain activity.
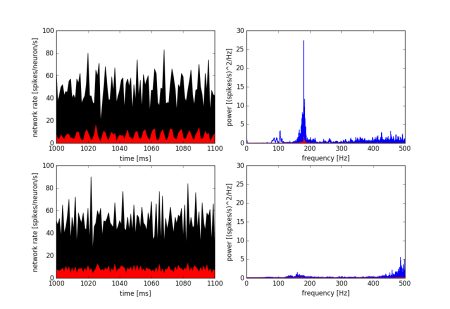
Ripples (140–220 Hz) are patterns of brain activity, seen in the local field potential of the hippocampus, that are important for memory consolidation. Cholinergic inputs to the hippocampus from neurons in the medial septum-diagonal band of Broca cause a marked reduction in ripple incidence as rodents switch from memory consolidation to memory encoding behaviors. The mechanism for this disruption in ripple power is not fully understood. Among the major effects of acetylcholine (or carbachol, a cholinomimetic) on hippocampal neurons are 1) an increase in membrane potential, 2) a decrease in the size of spike after hyperpolarization (AHP), and 3) an increase in membrane resistance. Using an existing model of hippocampal ripples that includes 5000 interconnected neurons (Brunel and Wang, 2003), we manipulated these parameters and observed their effects on ripple power. Shown here, the network firing rate and ripple power of the original model (top row; pyramidal neuron data is shown in red, interneuron data is shown in black) undergo marked changes following a decrease in pyramidal neuron AHP size, as well as an increase in the membrane voltage of both types of neurons. These changes could be the means whereby cholinergic input suppresses hippocampal ripples.
Read the paper in Hippocampus.
Multiscale Modeling of Anion-exchange Membrane for Fuel Cells
By Jibao Lu, Liam Jacobson, Justin Hooper, Hongchao Pan, Dmitry Bedrov, and Valeria Molinero, Kyle Grew and Joshua McClure, and Wei Zhang and Adri Duin
University of Utah, US Army Research Laboratory, Pennsylvania State University
Analyzing and Predicting Stream Properties
By Milada Majerova and Bethany Neilson
Utah Water Research Laboratory, Utah State University
Role of Stacking Disorder in Nucleation, Growth and Stability of Ice
By Laura Lupi, Arpa Hudait, Baron Peters, and Valeria Molinero
Molinero Group, Department of Chemistry
Quantifying Contributions from Natural and Non-local Sources to Uintah Basin Ozone
By Huy Tran, Seth Lyman, Trang Tran, and Marc Mansfield
Bingham Entrepreneurship & Energy Research Center, Utah State University
Data Assimilation for Improving WRF Performance in Simulating Wintertime Thermal Inversions in the Uintah Basin
By Trang Tran, Huy Tran, and Erik Crosman
Utah State University and University of Utah

Understanding Wind Energy
By Gerard Cortina and Marc Calaf
Wind Energy & Turbulence, Department of Mechanical Engineering, University of Utah
The Wind Energy and Turbulence laboratory was designed to improve the current understanding of wind energy harvesting. To achieve this goal we dedicate much of our efforts to develop new knowledge on the turbulent atmospheric boundary layer. Our focus resides on solving high resolution numerical simulations with the help of the Center for High Performance Computing at the University of Utah, which we ultimately complement with the analysis of experimental data.
Currently we mainly use Large Eddy Simulations, which are capable of resolving most of the atmospheric turbulent scales as well as the wind turbines, providing very good results when compared to the experimental data. We are highly interested in improving the current conception of the land-atmosphere energy exchanges, and our work strives to fill the gaps of our current understanding. It is only by properly capturing the land-atmosphere connection that forces the atmospheric flow aloft that we will be able to reproduce with high accuracy the atmospheric flow.
Tracking Pressure Perturbations Resulting From Thunderstorm Complexes
By Alexander Jacques
MesoWest/SynopticLabs and Department of Atmospheric Sciences, University of Utah
Clean Coal: Powered by Exascale
By Philip J. Smith and Michal Hradisky
CCMSC, University of Utah
The mission of the Carbon-Capture Multidisciplinary Simulation Center (CCMSC) at the University of Utah is to demonstrate the use of exascale uncertainty quantification (UQ) predictive simulation science to accelerate deployment of low-cost, low-emission electric power generation to meet the growing energy needs in the United States and throughout the world. The two main objectives, advancing simulation science to exascale with UQ-predictivity in real engineering systems and use of high-performance computing (HPC) and predictive science to achieve a societal impact, are linked together through an overarching problem: simulation of an existing 1,000 MW coal-fired ultra-supercritical (USC) boiler and simulation of a design 500 MW oxy-coal advanced ultra-supercritical (AUSC) boiler.
Read the full article in the newsletter.
Tackling Large Medical Genomics Datasets
By Barry Moore
USTAR Center for Genetic Discovery, University of Utah
The University of Utah has a long and rich history of genetic research that spans decades and has led to the discovery of over 30 genes linked to genetic disease. These Utah discoveries range from relatively common and well-known heritable disease, such as breast cancer linked to BRCA1/BRCA2 genes, to the truly obscure Ogden syndrome, which in 2010 became the first new genetic disease to be described based on genome sequencing. The Utah Genome Project (UGP), together with clinical investigators across the University of Utah, is continuing this tradition of cutting edge genetic research in Utah by launching several large medical genomics projects over the last year. The USTAR Center for Genetic Discovery (UCGD)—the computational engine for the UGP—has partnered with the University’s Center for High Performance Computing (CHPC) to tackle the massive datasets and the large scale computing requirements associated with these projects.
Read the full article in the newsletter.
Linking Frost Timing to Circulation Patterns
By Courtenay Strong and Gregory McCabe
United States Geological Survey
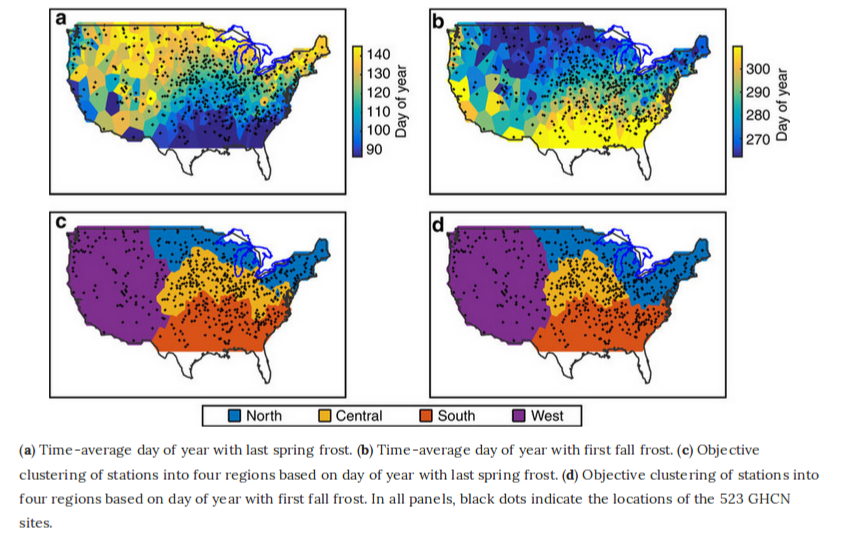
Atmospheric sciences professor Courtenay Strong and Gregory McCabe of the United States Geological Survey studied how frost timing (specifically, the lengthening of the frost-free season) is influenced by global warming and local atmospheric circulation by utilizing objective-clustering algorithms and optimization techniques. By discovering the circulations responsible for frost timing in different climatic regions of the conterminous United States, they found that atmospheric circulation patterns account for between 25 and 48 percent of variation in frost timing.
Read the paper in Nature Communications or read the article in UNews.
Efficient Storage and Data Mining of Atmospheric Model Output
By Brian Blaylock and John Horel
Department of Atmospheric Sciences, University of Utah
Our group … purchased 30TB in CHPC’s pando [archive storage] system to test its suitability for several research projects. We have relied extensively over the years on other CHPC storage media such as the tape archive system and currently have over 100TB of network file system disk storage. However, the pando system is beginning to meet several of our interwoven needs that are less practical using other data archival approaches: (1) efficient expandable storage for thousands of large data files; (2) data analysis using fast retrieval of user selectable byte-ranges within those data files; and (3) the ability to have the data accessible to the atmospheric science research community.
The CHPC pando storage archive has made it possible for us to efficiently archive, access, and analyze a large volume of atmospheric model output. Several researchers outside the University of Utah have already discovered its utility in the short time that the archive has been available.
Read the full article in the newsletter.
Modeling Pollution in Utah's Valleys
By Christopher Pennell
Utah Division of Air Quality
The Utah Division of Air Quality simulated a high pollution episode that occurred during the first eleven days of January, 2011. Using CHPC resources, we produced a high resolution, hourly animation showing when levels of fine particulate matter (PM2.5) far exceeded federal standards in Northern Utah.
Air pollution builds up during the day with the onset of sunlight and human activity. Pollution levels greatly decrease in the late evening except when a persistent temperature inversion gets established in Utah’s valleys. As inversion conditions persist, air pollution steadily accumulates across several days triggering public health concerns. We are left waiting for a strong winter storm that can destroy surface air stability and bring in fresh clean air.
Our pollution modeling not only accounts for human activity, but also for the mechanisms that make particulate pollution from emitted gases. The computational power provided by CHPC allows the State of Utah to model the complex relationship between meteorology, human activity, and air chemistry with impressive precision.
Cryo-EM at the University of Utah
By Peter Shen
Department of Biochemistry, University of Utah
In recent years, the University of Utah has established an outstanding core base of cryo-electron microscopy (cryo-EM) expertise and compiled a strong track record of performing impactful cryo-EM research. These efforts have resulted in the University of Utah being awarded one of five $2.5 million grants from the Arnold and Mabel Beckman Foundation to establish a world-class cryo-EM facility.
Most of the cryo-EM data analysis procedures at the University of Utah are performed using CHPC resources. CHPC supports many software packages used in cryo-EM data processing, including RELION, EMAN2, SPIDER, FREALIGN, BSoft, and cryoSPARC.
One major focus in the field [of cryo-electron microscopy] is to fully automate the entire pipeline of recording cryo-EM movies, de-blurring the images, identifying the particles, and reconstructing them in 3D. Perhaps the time is not far off when high-quality 3D reconstructions will be attainable within hours after the cry-EM imaging session. Our ongoing collaborations with CHPC will certainly play an important role for this dream to become a reality here at the University of Utah.
Read the full article in the newsletter.
The Effects of Wind Angle on the Effectiveness of Erosion Control Structures
By Eden Furtak-Cole
Department of Mathematics and Statistics, Utah State University
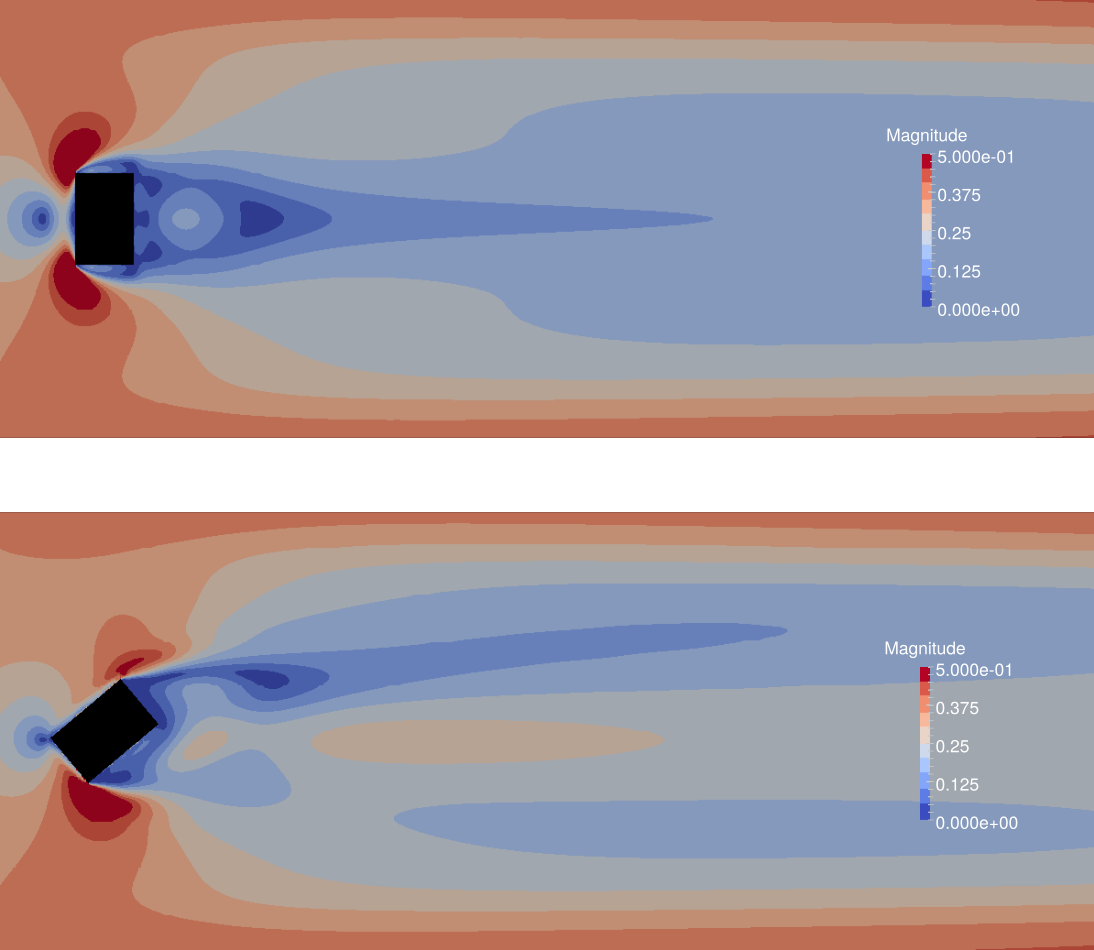
Roughness elements experiments have been conducted at the Owens lake playa to control harmful PM10 emissions. These maps of shear stress magnitude result from a 3D simulation of flow over box-shaped roughness elements, used for erosion control. Flow is from left to right. The rotated element is shown to be less effective in reducing shear, though it has a greater frontal area exposed to the wind direction. This underscores the importance of 3D simulation in predicting atmospheric boundary layer flows. Simulations were conducted by solving the incompressible Navier-Stokes equations with OpenFOAM.
Using CHPC resources to calculate chemical similarity of species of tropical trees
By Gordon Younkin
Department of Biology, University of Utah
We have developed a metric to quantify the similarity of defensive compounds (secondary metabolites) among different species of plants. The goal is to address fundamental questions in the ecology of tropical forests: What is the origin of the extremely high diversity? How is the exceedingly high local diversity maintained? Our hypothesis is that the answers have to do with the interactions of plants with their herbivores, with particular importance ascribed to the chemical defenses of plants. Here, we report on how we used CHPC resources to quantify the chemical similarity among species of plants.
Using ultra performance liquid chromatography-mass spectrometry (UPLC-MS), we examined the chemical profiles of 166 species of Inga, a genus of tropical trees. Among these species, we have recorded nearly 5000 distinct compounds, most of which are of unknown structure. Based on the abundance of these compounds in each species, we can calculate the overall chemical similarity of each species pair. While each individual calculation is not all that resource-intensive, we have multiple individuals for each species for a total of 795 individuals. Pairwise comparisons between all individuals requires 316,410 separate similarity calculations, a task much too large for a desktop computer. We have parallelized these calculations on a CHPC cluster, where the calculations finish in a matter of hours.
Uncertainty Quantification of RNA-Seq Co-expression Networks
By Lance Pflieger and Julio Facelli
Department of Biomedical Informatics, University of Utah
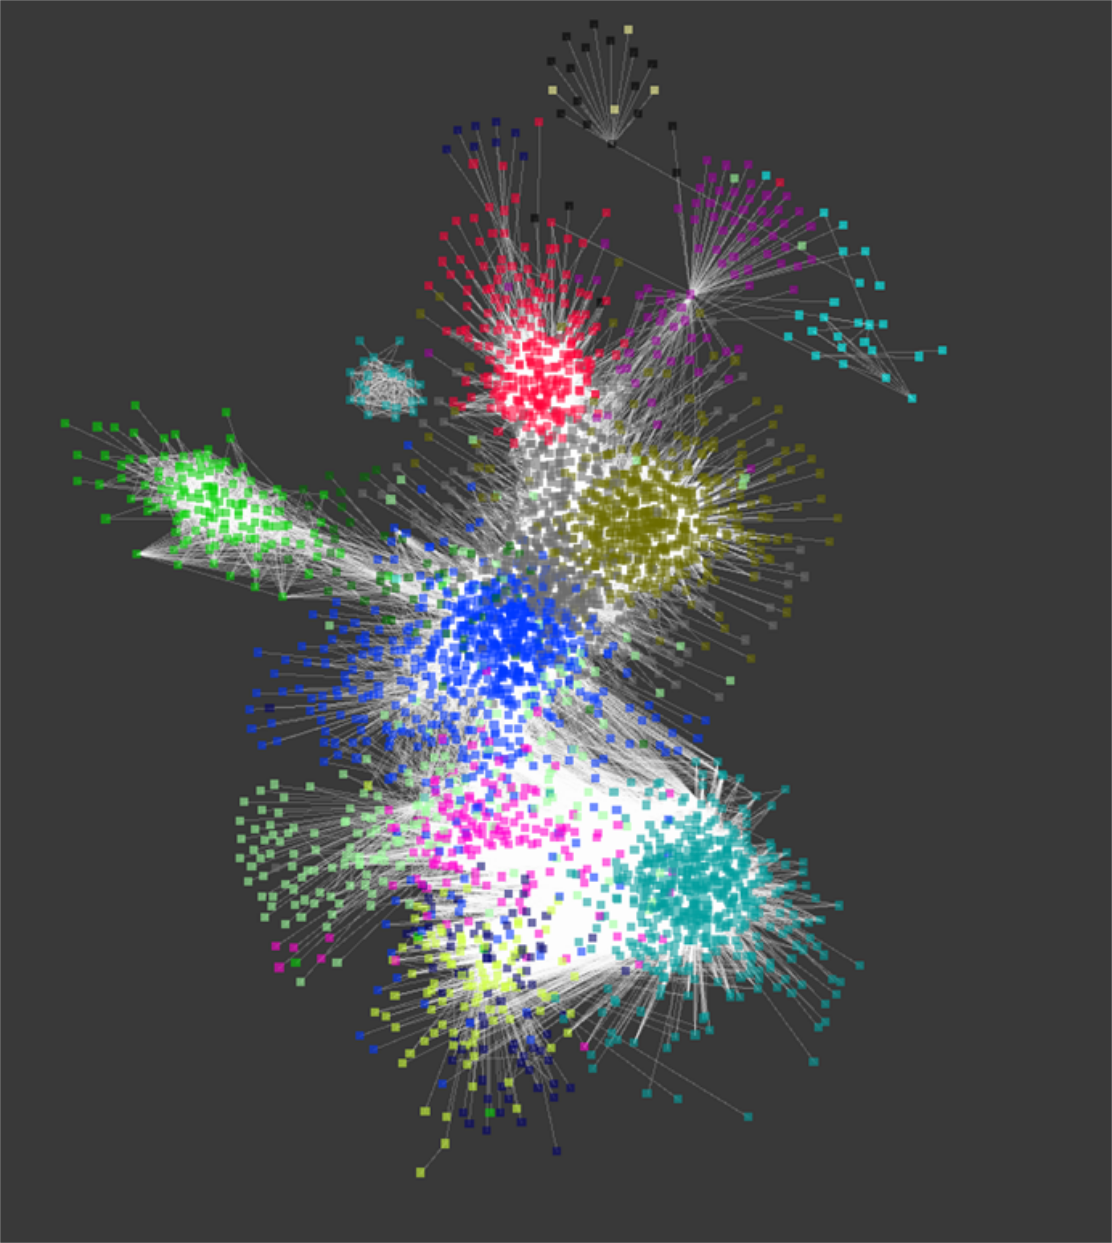
Systems biology utilizes the complex and copious data originating from the “omics” fields to increase understanding of biology by studying interactions among biological entities. Gene co-expression network analysis is a systems biology technique derived from graph theory that uses RNA expression data to infer functional similar genes or regulatory pathways. Gene co-expression network analysis is a computationally intensive process that requires matrix operations on tens-of-thousands of genes/transcripts. This technique has been useful in drug discovery, functional annotation of a gene and insight into disease pathology.
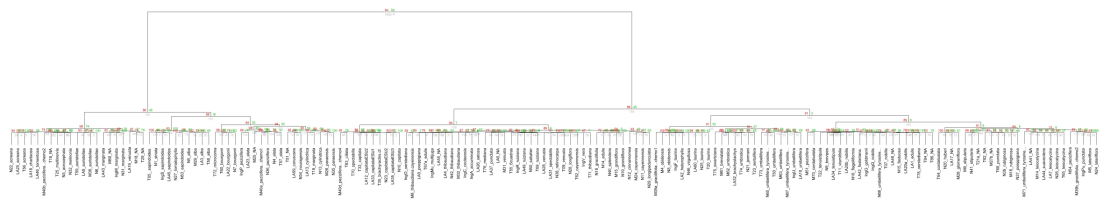
To assess the effect of uncertainty inherent with gene expression data, our group utilized CHPC resources to characterize variation in gene expression estimates and simulate a large quantity of co-expression networks based on this variation. The figure shown is a representation of network generated using WGCNA and expression data from the disease Spinocerebellar Type 2 (SCA2). The colors represent highly connected subnetworks of genes which are used to correlate similar gene clusters with a phenotypic trait. Our results show that uncertainty has a large effect on downstream results including subnetwork structure, hub genes identification and enrichment analysis. For instance, we find that the number of subnetworks correlating with the SCA2 phenotype varies from 1 to 6 subnetworks. While a small gene co-expression network analysis can be performed using only modest computation resources, the scale of resources required to perform uncertainty quantification (UQ) using Monte Carlo ensemble methods is several orders of magnitude larger, which are only available at CHPC.
The Music of Fault Zones
By Amir Allam, Hongrui Qiu, Fan-Chi Lin, and Yehuda Ben-Zion
Department of Geology & Geophysics, University of Utah
We deployed 108 seismometers in a dense line across the most active fault in Southern California (the San Jacinto fault) and recorded 50 small earthquakes. This animation shows how the fault zone itself is resonating due to the passing waves. The earthquakes are exciting normal mode oscillations - just like on a guitar string - directly underneath the seismometers. This is due to a zone of highly damaged rocks near the active fault which act to trap passing seismic energy. This resonance decreases in amplitude with increasing distance from the fault zone.
Lanthanide Ion Thermochemistry and Reactivity with Small Neutrals: Benchmarking Theory
By Maria Demireva and P. B. Armentrout
Armentrout Research Group, Department of Chemistry
Heavy elements, such as the lanthanides, are difficult to describe theoretically because of spin-orbit and relativistic effects and the many electronic configurations that arise from the valence electrons occupying the 4f shell. Testing different theoretical models requires benchmarks from experiment. Thermochemistry measured from gas phase experiments, where small systems can be probed in isolation from solvent or substrate molecules, can serve as useful standards. Additionally, results from such experiments can be used together with theory to learn about the properties and behavior of these heavy elements, which remain relatively unexplored. For example, we have studied the exothermic activation of CO2 by the lanthanide gadolinium cation to form the metal oxide cation (GdO+) and CO. Because the ground state reactant and product ions differ in their spin states while the neutrals have singlet states, the reaction between ground state reactants and products is formally spin-forbidden. Yet experiment indicates that the reaction occurs efficiently and without any barriers. This can be explained by theoretical calculations, which reveal that the surface correlating with the ground state reactants likely mixes in the entrance channel with the surface correlating with the ground state products. Because there are no barriers along these potential energy surfaces that exceed the reactant asymptote, the reaction can proceed with relatively high efficiency at thermal collision energies. An increase in reaction efficiency is observed in the experiments at higher collision energies. From theoretical calculations, this increase can be attributed to the reactants having enough energy to surmount a barrier found along the potential energy surface of the ground state reactants such that an electronically excited GdO+ product can be formed directly via a single diabatic surface. Although the theoretical calculations can explain qualitatively the experimental results, it is also important that they quantitatively agree. Comparison with high level calculations indicate that there is room for improvement. Combination of precise and accurate experiments with state-of-the-art computational resources provides detailed energetics and mechanistic understanding of lanthanide reactivity that would be difficult to gain by experiment or theory alone.
95th percentile of 10 meter wind speed for every hour in May, June, and July 2015-2017. Strong winds often occur during evening hours, over mountain ridges, oceans, and Great Lakes, and the mountain and central states. This video has been truncated to better fit this format.
Weather Statistics with Open Science Grid
By Brian Blaylock and John Horel
Department of Atmospheric Sciences, University of Utah
CHPC's Pando archive hosts 40+ TB of weather model analyses and forecasts from the High Resolution Rapid Refresh model beginning April 2015. Resources from the Open Science Grid were used to quickly retrieve data from the Pando archive and calculate percentile statistics for several weather variables. Percentiles from three years of data were calculated for every hour of the year using a 30 day window centered on each hour. These statistics are being used to perform data quality checks of in situ weather observations and provide meteorologists insight on model performance at specific locations.
Oriented Attachment of ZIF-8 Nanoparticles
By the Grünwald Group
Department of Chemistry, University of Utah
Nanocrystal growth can occur through a variety of different mechanisms. Our group uses molecular dynamics simulations to visualize these various processes. In this case, two ZIF-8 nanocrystals, once close enough proximity to each other, coalesce through oriented attachment to form a larger nanocrystal.
Formation of COF-5 in an Implicit Solvent Model
By Grünwald Group
Department of Chemistry, University of Utah
These three movies describe the formation of covalent organic framework, No. 5 (usually known as COF-5) in an implicit solvent model. The description for each of them is as follows:
- An extreme case in which the stacking interaction among molecules are turned off thus no COF structure formed after hundreds of nanoseconds.
- At experimental condition, the formation occurs through an event called "spinodal decomposition" which results in the creation of defective COF motifs spontaneously in the solution.
- A single case where the stacking interaction is scaled smaller so that the crystallization of COF-5 happens through the growth of a single, defect-free crystal, which is much desired in experiment.
The Utah PRISMS Ecosystem: An Infrastructure for Global Exposomic Research
By Ramkiran Gouripeddi1,2, Mollie Cummins1,2,3, Julio Facelli1,2, and Katherine Sward1,2,3
1Department of Biomedical Informatics, 2Center for Clinical and Translational Science, 3College of Nursing, University of Utah
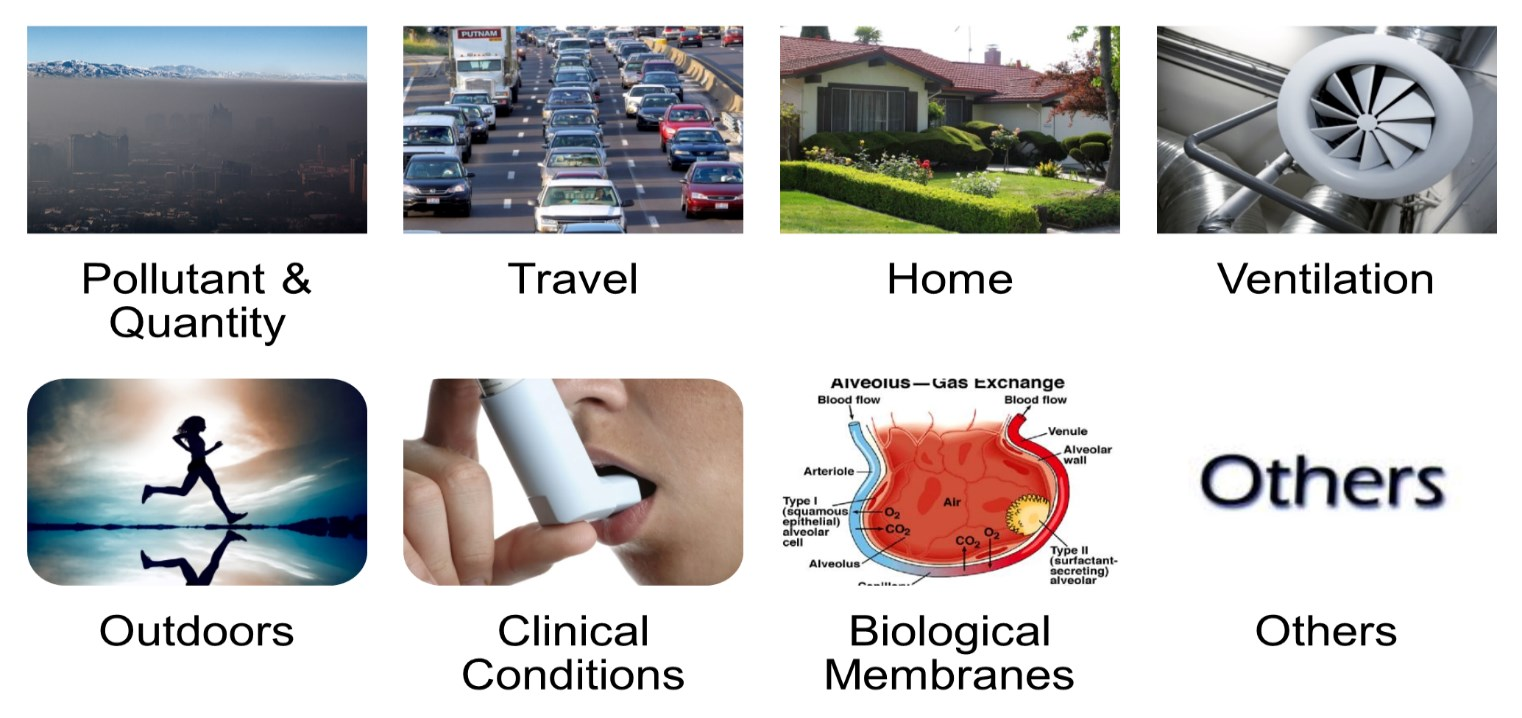
The Utah PRISMS (Pediatric Research Using Integrated Sensor Monitoring Systems) Team uses a systematic approach to aggregate data on environmental exposures and socio-economic factors to explore potential effects of the modern environment on health. The project uses sensor measurements and information from individuals in the community to support research at both the population and personal level. It supports a standards-based, open source informatics platform to meaningfully integrate sensor and biomedical data and consists of:
- Data Acquisition Pipeline: Hardware and software, wireless networking, and protocols to support easy system deployment for robust sensor data collection in homes, and monitoring of sensor deployments.
- Participant Facing Tools: Annotate participant generated data, display sensor data, and inform participants of their clinical and environmental status.
- Computational Modeling: Generate high resolution spatio-temporal data in the absence of measurements as well as for recognition of activity signatures from sensor measurements.
- Central Big Data Integration Platform (OpenFurther): Standards-based, open-access infrastructure that integrates study-specific and open sensor and computationally modeled data with biomedical information along with characterizing uncertainties associated with these data.
- Researcher Facing Platforms: Tools and processes for researchers performing exposomic studies of a variety of experimental designs.
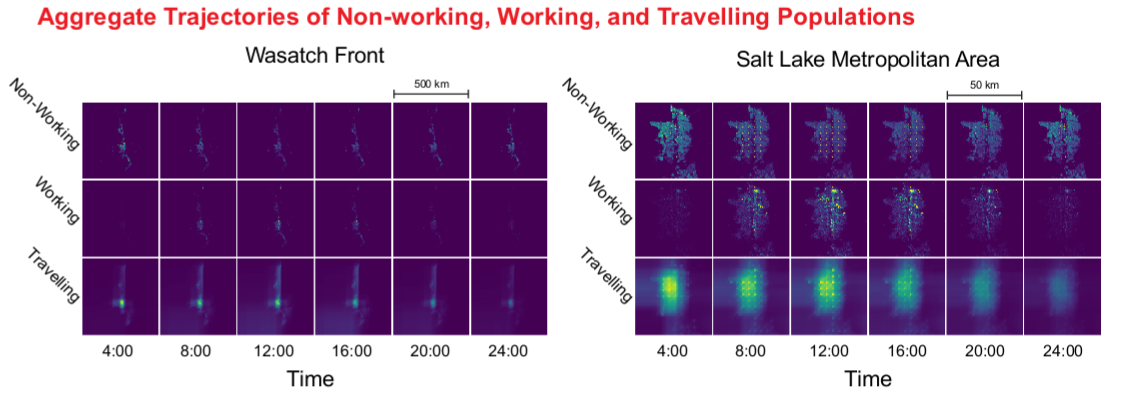
An Agent-Based Model for Estimating Human Activity Patterns on the Wasatch Front
By Albert M. Lund1,2, Nicole B. Burnett2,3, Ramkiran Gouripeddi1,2, and Julio C. Facelli1,2
1Department of Biomedical Informatics, 2Center for Clinical and Translational Science, 3Department of Chemistry, University of Utah
It is difficult to measure the impact of air quality on human health because populations are mobile. Additionally, air quality data is reported at low geographic resolutions (> 1 km2), which makes it difficult to characterize acute local variations in air quality. There are few examples of combining human movement and activity data with high resolution air quality data to capture trajectory based exposure profiles in a comprehensive way. An agent-based model helps simulate human activities and locations throughout an arbitrary day. Simulation is used to overcome the limitations of existing datasets; simulated households based on aggregate data for the state of Utah are modeled and activity profiles generated from the American Time Use Survey of the U.S. Bureau of Labor Statistics. The activity profiles are combined with the simulated households to build individual trajectories of activity and location over the desired region of study.
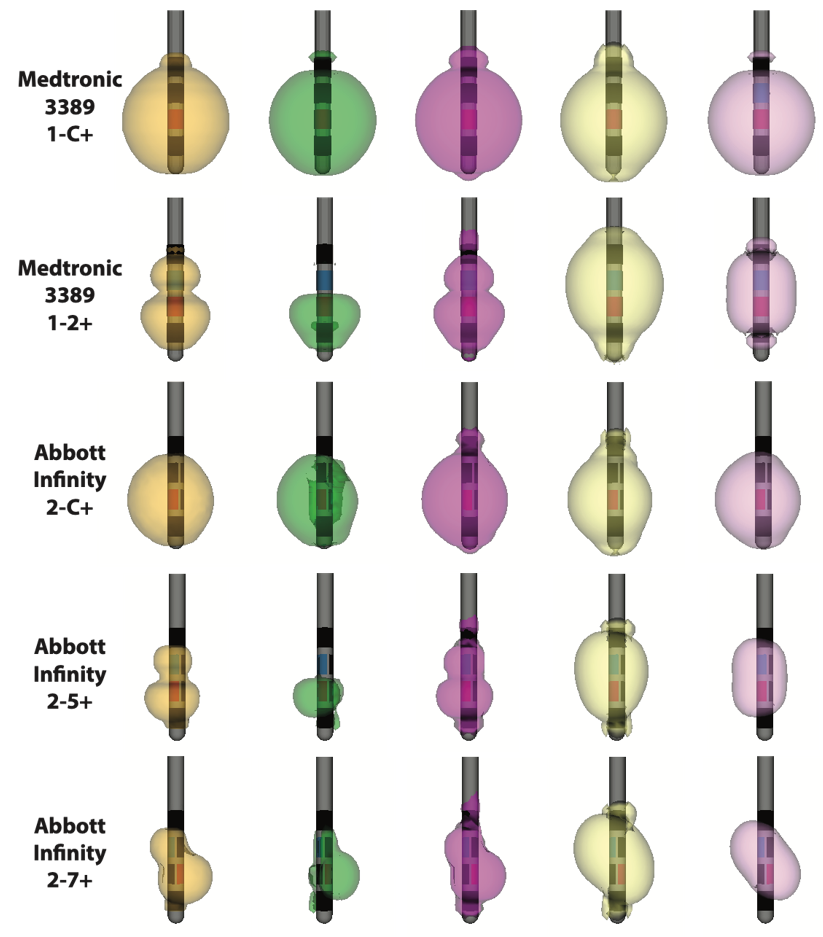
How will new technology change deep brain stimulation programming?
By G. Duffley1, J. Krueger2, A. Szabo3, B. Lutz4, M.S. Okun5, and C.R. Butson1
1University of Utah, 2University of Duisberg-Essen, 3Medical College of Wisconsin, 4University of North Carolina Wilmington, 5University of Florida
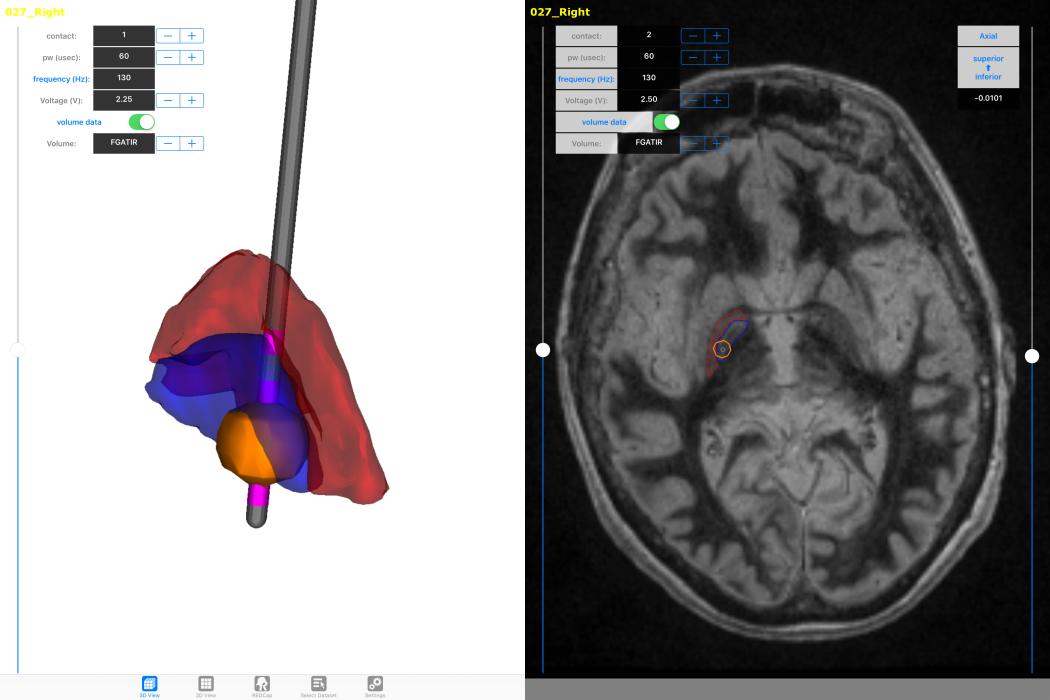
For movement disorders the typical programming process consists of a nurse or physician systematically moving through a subset of the over 10,000 possible stimulation settings looking for benefit as well as known side effects by visually examining the patient. Once this information is found, the nurse searches for the best stimulation setting within the range of those that do not induce an apparent side effect. Once what is assumed to be the best setting is found, the patient is sent home, only to return on average a month later to tweak the stimulation settings based on long term side effects or residual motor disability. The burden of travel to attend regular DBS [deep brain stimulation] programming sessions is high for patients and their primary caregivers. The objective of our study is to test a clinical decision support system that we believe will enable nurses to more effectively achieve these goals [of adequate symptom relief with minimal side effects]. We are prospectively assessing changes in DBS programming time, patient outcomes, quality of life, and family caregiver burden using an iPad-based mobile app to program DBS devices for PD [Parkinson's disease] patients. Our computational models show there is some variability between the location and spatial extent of best stimulation settings at six months across patients, but it is unknown if the same level of variability exists within individual patients. So far, programming time hasn't been significantly reduced, but the challenge of changing clinician behavior is non-trivial. Determining how our technology fits within the context of DBS programming algorithms is an open question. Developing an easy to follow, but effective, workflow for novice programmers will be essential for phase two of the trial to succeed.
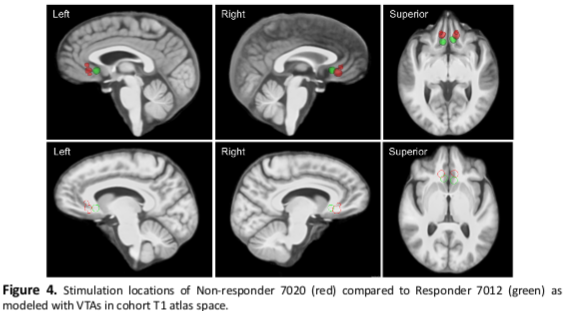
Structural Imaging Evaluation of Subcallosal Cingulate Deep Brain Stimulation for Treatment-resistant Depression
By Kara A. Johnson1,2; Darren L. Clark, PhD3; Gordon Duffley1,2; Rajamannar Ramasubbu, MD3; Zelma H.T. Kiss, MD3; and Christopher R. Butson, PhD1,2,4
1Department of Bioengineering; 2Scientific Computing & Imaging (SCI) Institute; 3Departments of Clinical Neurosciences and Psychiatry, University of Calgary; 4Departments of Neurology and Neurosurgery
Deep brain stimulation (DBS) of the subcallosal cingulate cortex (SCC) is an investigational therapy for treatment-resistant depression (TRD). There is a wide range of response rates for SCC DBS for TRD. The ideal location and extent of stimulation within the SCC to produce substantial therapeutic effects are currently unknown and may vary between patients. We used T1-weighted structural MRI to make between- and within-subject comparisons of volumes of tissue activated (VTAs) relative to structural anatomy to make observations about the effects of stimulation location and settings on clinical response. Our preliminary results suggest that stimulation location and volume relative to T1 structural anatomy alone may not predict clinical response in SCC DBS for TRD. Therapeutic response to SCC DBS may depend on a combination of several factors, such as patient-specific stimulation parameters, duration of stimulation, or other factors that play a role in specific fiber activation. Further analysis is warranted to elucidate whether stimulation locations, parameters, and durations predict therapeutic response to SCC DBS.
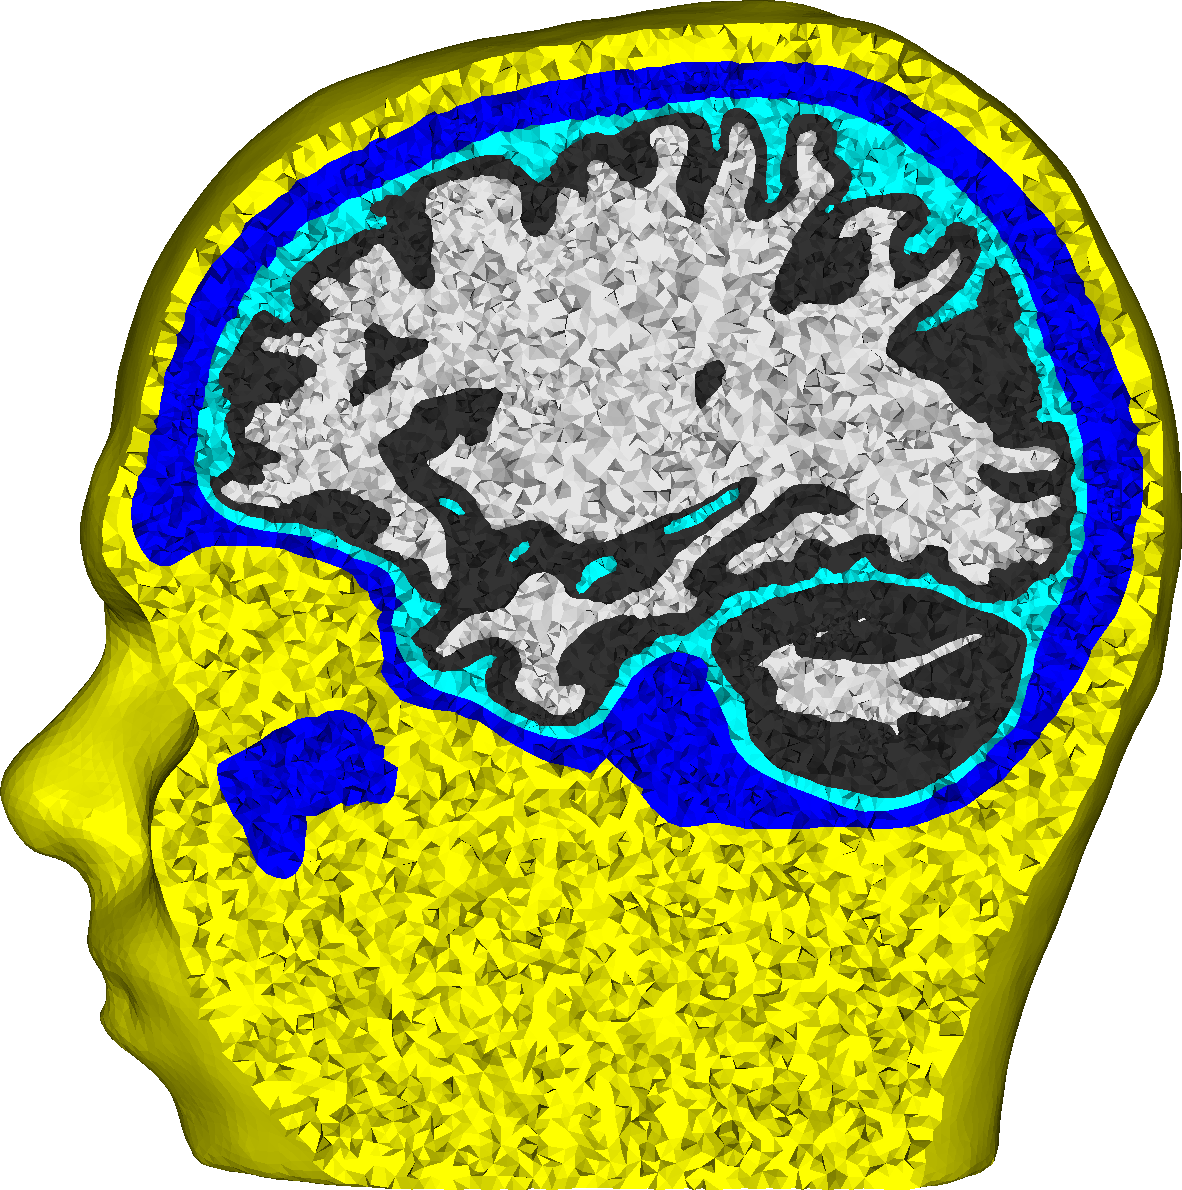
Influence of Uncertainties in the Head Tissue Conductivities on the EEG Forward Problem
By James Vorwerk1, Carsten H. Wolters2, and Christopher R. Butson1
1Scientific Computing and Imaging (SCI) Institute, University of Utah and 2Institute for Biomagnetism and Biosignalanalysis, University of Münster
For accurate EEG [electroencepahlography] source analysis, it is necessary to solve the forward problem of EEG as exact as possible. We investigate the influence of the uncertainty with regard to the conductivity values of the different conductive compartments of the human head on the EEG forward and inverse problem. The goal is to identify for which of these compartments varying conductivity values have the strongest influence, so that these conductivity values can be individually calibrated in future studies. For the investigated source in the somatosensory cortex, the skull conductivity clearly has the strongest influence, while white and gray matter conductivities have a very low influence. If possible, an individual calibration of the skull conductivity should therefore be performed. The feasibility of a calibration of further conductivity values based on SEPs [somatosensory evoked potentials] is questionable given the dominance of the skull conductivity. This study shows that besides the geometrical modeling of the conductive compartments of the human head, also the conductivity values assumed for these compartments have a strong influence in EEG source localization.
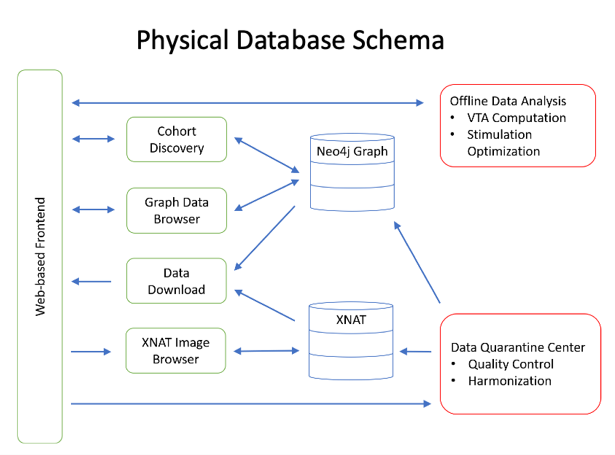
The International Neuromodulation Registry: A Graph Database Representation for Neuromodulation Therapies
By Hedges, D.M.1,2, Duffley, G.1,3, Hegman, J.C.1, Gouripeddi, R.2,4, Butson, C.R.1,3,5,6,7
1Scientific Computing and Imaging (SCI) Institute, 2Department of Biomedical Informatics, 3Department of Biomedical Engineering, 4Center for Clinical and Translational Science, 5Department of Neurology, 6Department of Neurosurgery, 7Department of Psychiatry, University of Utah
Deep Brain Stimulation (DBS) is a form of Neuromodulation therapy, often used in patients with many different types of neurological disorders. However, DBS is a rare treatment and medical centers have few patients who qualify for DBS, meaning that most DBS studies are statistically underpowered and have chronically low n values. Here, we present a platform designed to combine disparate datasets from different centers. Using this platform, researchers and clinicians will be able to aggregate patient datasets, transforming DBS studies from being center-based to being population-based.
Graph databases are increasing in popularity due to their speed of information retrieval, powerful visualization of complex data relationships, and flexible data models. Our Neo4j DBMS is physically located in the University of Utah Center for High-Performance Computing (CHPC) Protected Environment on a virtual machine, giving needs-based flexibility for both memory and storage.
This patient registry has been build on a next-generation graph database. Through a formal, but flexible, data model and ontology, this platform is able to harmonize disparate data types and allows for simple visualizations of complex data types.
Anticipated Use Cases: Cohort discovery, data and imaging download, exploratory analysis.
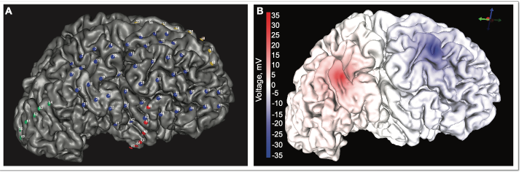
Cortical Surface Electrode Localization Uncertainty
By Chantel M. Charlebois1,2, Kimia Shayestehfard3, Daria Nesterovich Anderson1,2, Andrew Janson1,2, Jeneva Cronin4, Moritz Dannhauer2, David Caldwell4, Sumientra Rempersad3, Larry Sorenson4, Jeff Ojemann5, Dana Brooks3, Rob MacLeod1,2, Christopher R. Butson1,2, Alan Dorval1
1Department of Biomedical Engineering; 2Scientific Computing and Imaging (SCI) Institute, University of Utah; 3Department of Electrical & Computer Engineering, Northeastern University; 4Department of Bioengineering; 5Department of Neurological Surgery, University of Washington
Electrocorticography (ECoG) is an invasive technique commonly used to monitor patients with intractable epilepsy to aid in seizure onset localization and eloquent cortex mapping. Modeling accurate electrode locations is necessary to make predictions about stimulation of seizure focus localization.
- Brain shift occurs after surgical implantation of the ECoG array. When the post-operative CT is co-registered to the pre-operative MRI the electrodes appear to be inside the brain instead of on the cortical surface
- The electrode localization and projection to the cortical surface are based off of thresholding the CT. CT acquisition between patients and centers differs, therefore we want to use a threshold that is insensitive to these differences
Aim: Determine if the CT threshold range affects electrode localization and the resulting simulation of clinical ECoG measurements during stimulation.
We created three finite element meshes with the three different electrode localizations based on their threshold range and solved the bioelectric field problem for bipolar stimulation between electrodes 18 (0.5 mA source) and 23 (-0.5 mA sink), shown in above image. We compared simulations for three different electrode-localizations based on a small, medium, and large CT threshold range to clinical recordings. The three threshold models did not have large voltage differences when simulating clinical stimulation. Moving forward, we can use any of the threshold ranges because they did not greatly differ in their simulation solutions. This insensitivity to the threshold range gives us more confidence in the electrode locations of our models.
Support from a Joint US (NFS) German (DRG) Collaborative Research in Computational Neuroscience grant, IIS-1515168; an NSF CAREER award, 1351112; and an NIH P 41, GM103545, "Center for Integrative Biomedical Computing".
Fiber Pathway Activation with Deep Brain Stimulation Electrode Designs
By Andrew Janson1,2, Daria Nesterovich Anderson1,2, Christopher R. Butson1,2,3,4
1Department of Biomedical Engineering, 2Scientific Computing and Imaging (SCI) Institute, 3Departments of Neurology and Neurosurgery, 4Department of Psychiatry, University of Utah
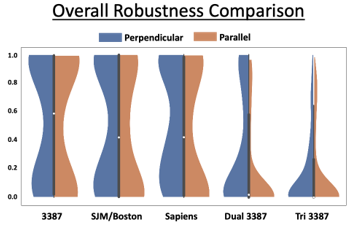
Clinical outcomes for patients with deep brain stimulation (DBS) are highly variable. Two critical factors underlying this variability are where and how stimulation is applied. Variability in lead placement has also been observed for the same target across a patient cohort. Computational modeling of DBS has demonstrated that minor variations in lead location and the shape of the electric field can lead to drastic variations in the effects of stimulation. Our hypothesis is that the use of new directional-steering electrodes or multiple electrodes can compensate for variability in lead placement and provide more robust control over fiber activation compared to current cylindrical electrodes. This means an electrode design or configuration is robust if it is able to provide acceptable stimulation from its contacts to maximally activate the fiber pathway in scenarios where its location with respect to the target may vary.
To evaluate the ability of new directional electrode designs and multielectrode configurations to robustly activate target fiber pathways. We aim to determine how DBS targeting can be improved to handle lead location uncertainty.
We found variability in lead location decreases the ability for current DBS electrodes to activate the target fiber pathway. New directional electrode designs can overcome some amount of location variability by steering current towards the target, but the ability to shape the electric field across multiple leads provides control of target activation that is more robust to off-target lead locations.
Support contributed by NIH, NINDS Grant UH3NS095554
Who's who? Detecting and resolving sample anomalies in human DNA sequencing studies with Peddy.
By Brent S. Pedersen & Aaron R. Quinlan
Department of Human Genomics and USTAR Center for Genetic Discovery, University of Utah
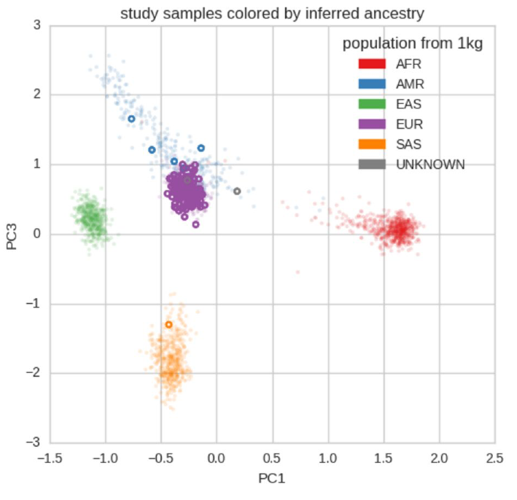
The potential for genetic discovery in human DNA sequencing studies is greatly diminished if DNA samples from the cohort are mislabelled, swapped, contaminated, or include unintended individuals. The potential for such errors is significant since DNA samples are often manipulated by several protocols, labs or scientists in the process of sequencing. We have developed Peddy to identify and facilitate the remediation of such errors via interactive visualizations and reports comparing the stated sex, relatedness, and ancestry to what is inferred from each individual's genotypes. Peddy predicts a sample's ancestry using a machine learning model trained on individuals of diverse ancestries from the 1000 Genomes Project reference panel. Peddy's speed, text reports and web interface facilitate both automated and visual detection of sample swaps, poor sequencing quality and other indicators of sample problems that, were they left undetected, would inhibit discovery. Peddy is used as part of our Base2 Genomics system for analyzing whole-genome sequencing data.
Available at https://github.com/brentp/peddy.
Nanopore sequencing reveals rapid evolution of poxvirus genome structure driven by host-pathogen conflict
By Tom Sasani, Kelsey Rogers-Cone, Ryan Layer, Nels Elde & Aaron R. Quinlan
Quinlan Lab, Department of Human Genomics and USTAR Center for Genetic Discovery, University of Utah
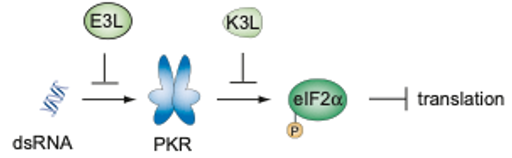
Vaccinia virus (VACV) encodes two host-range factors, E3L, and K3L, that each disrupt key antiviral host defenses. In the absence of E3L, VACV has been shown to rapidly adapt by duplicating K3L in tandem arrays, which confers a significant increase in fitness. Additionally, viruses accumulate H47R mutations within K3L, which provides an added fitness benefit. In order to investigate the relationship between K3L copy number amplification and H47R allele fixation, we sequenced VACV populations with the Oxford Nanopore (ONT) single-molecule platform. We discovered that H47R progressively accumulates within arrays of the duplicated K3L gene, and uncovered some of the interplay between allelic diversity and structural variation during viral evolution.
Identifying highly constrained protein-coding regions using population-scale genetic variation
By Jim Havrilla, Brent Pedersen, Ryan Layer, Aaron R. Quinlan
Quinlan Lab, Department of Human Genomics and USTAR Center for Genetic Discovery, University of Utah
Numerous methods (e.g., Polyphen and SIFT) exist to predict the impact of a genetic variant on protein function. None of these methods, however, take direct advantage of protein domain information, thereby potentially ignoring valuable information within the various functional portions of a protein. By integrating the ExAC database of protein-coding genetic variation taken from more than 60,000 human exomes with the Pfam database, we have comprehensively measured the landscape of genetic variation among all characterized protein domains. Computing variant densities, dN/dS ratios, and the distribution of those ratios for each domain per protein will allow us to develop a model that should more accurately predict the likelihood that a variant in a particular genomic location will actually lead to phenotypic change. The rationale of the model is that variants coinciding with protein domains with a high dN/dS value or tolerance for variation are less likely to have a functions impact, with the corollary being that variants affecting less tolerant domains are more likely to perturb protein function. We expect that comparing measures of each domain's intra-species variant "constraint" with inter-species conservation measures will further inform variant effect predictions.
We also aim to incorporate non-domain regions, the regions of protein in between and on the side of domains, which we call nodoms, so that we have a point of comparison across a protein. Additionally, we aim to utilize 3D positioning for variants - the location on a protein may indicate whether the variant is as deleterious as we may think. In that same vein, whether a variant overlaps an active site will also be taken into account. We will present our efforts to develop and validate a predictive model that integrates this information to reduce false negative and false positive predictions of the functional impacts of genetic variation in both research and clinical settings.
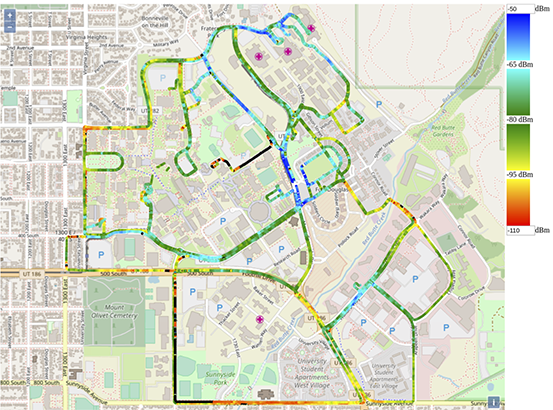
PAWR Platform POWDER-RENEW: A Platform for Open Wireless Data-driven Experimental Research with Massive MIMO Capabilities
POWDER: Jacobus (Kobus) Van der Merwe, University of Utah; RENEW: Ashutosh Sabharwal, Rice University. Other contributors can be found on the POWDER website.
This project creates a city-scale platform for advanced wireless research in Salt
Lake City, Utah. Platform for Open Wireless Data-driven Experimental Research (POWDER) supports at-scale experimentation of novel advanced wireless broadband and
communication technologies in the sub-6 GHz band. Featuring interactions with regional
networks encompassing initiatives on public transportation, broadband delivery, education
and health service delivery as well as advancement of science, technology and research
by creating an ecosystem of a hundred small companies in allied technical domains.
The ability to use POWDER will have a significant positive impact on the speed of
innovation in data networking and application domains. This effort will also benefit
educators and students at all levels of study in communications-related disciplines.
A key feature of the platform is the partnership with the Reconfigurable Eco-system for Next-generation End-to-end Wireless (RENEW) project at Rice University to develop a highly programmable and flexible
massive multi-input multi-output (MIMO) platform that is an essential feature of both 5G and beyond-5G wireless networks.
The platform will feature
- heterogeneous systems composed of programmable base stations, mobile devices and static sensors
- state of the art massive MIMO base-stations
- ability to conduct research over a diverse spectrum range (from 50 MHz to 3.8 GHz)
- a large-scale software defined wireless networking testbed integrated with an existing NSF-funded cloud testbed, thereby enabling end-to-end experimentation
Another unique aspect of the platform is support for wireless mobility-based studies, provided by using couriers with predictable movement patterns (e.g., buses), less predictable but bounded mobility (e.g., maintenance vehicles), and controllable couriers (e.g., on-site volunteers). Each of these deployed units will consist of "base" functionality that includes user-programmable software defined radios, "bring your own device" (BYOD) experiments, and will be connected via a sophisticated platform control framework. Existing fiber links will connect the wireless base stations to about half a dozen edge compute platforms. This will enable complex device provisioning and a set of tools for scientific workflow management, collaboration, and artifact sharing, with a goal towards promoting rigorous standards for reproducibility in this field.
For more information, see this video about the project.

Improved Genome Assembly and Annotation for the Rock Pigeon (Columba livia)
By Carson Holt, Michael Campbell, David A. Keays, Nathaniel Edelman, Aurélie Kapusta, Emily Maclary, Eric T. Domyan, Alexander Suh, Wesley C. Warren, Mark Yandell, M. Thomas P. Gilbert, and Michael D. Shapiro
Shapiro Lab, Department of Biology, University of Utah
Intensive selective breeding of the domestic rock pigeon (Columba livia) has resulted in more than 350 breeds that display extreme differences in morphology and behavior (Levi 1986; Domyan and Shapiro 2017). The large phenotypic differences among different breeds make them a useful model for studying the genetic basis of radical phenotypic changes, which are more typically found among different species rather than within a single species.
In genetic and genomic studies of C. livia, linkage analysis is important for identifying genotypes associated with specific phenotypic traits of interest (Domyan and Shapiro 2017); however, short scaffold sizes in the Cliv_1.0 draft reference assembly (Shapiro et al. 2013) hinder computationally-based comparative analyses. Short scaffolds also make it more difficult to identify structural changes, such as large insertions or deletions, that are responsible for traits of interest (Domyan et al. 2014; Kronenberg et al. 2015).
Here we present the Cliv_2.1 reference assembly and an updated gene annotation set. The new assembly greatly improves scaffold length over the previous draft reference assembly, and updated gene annotations show improved concordance with both transcriptome and protein homology evidence.
Read the full article as it appears in G3.
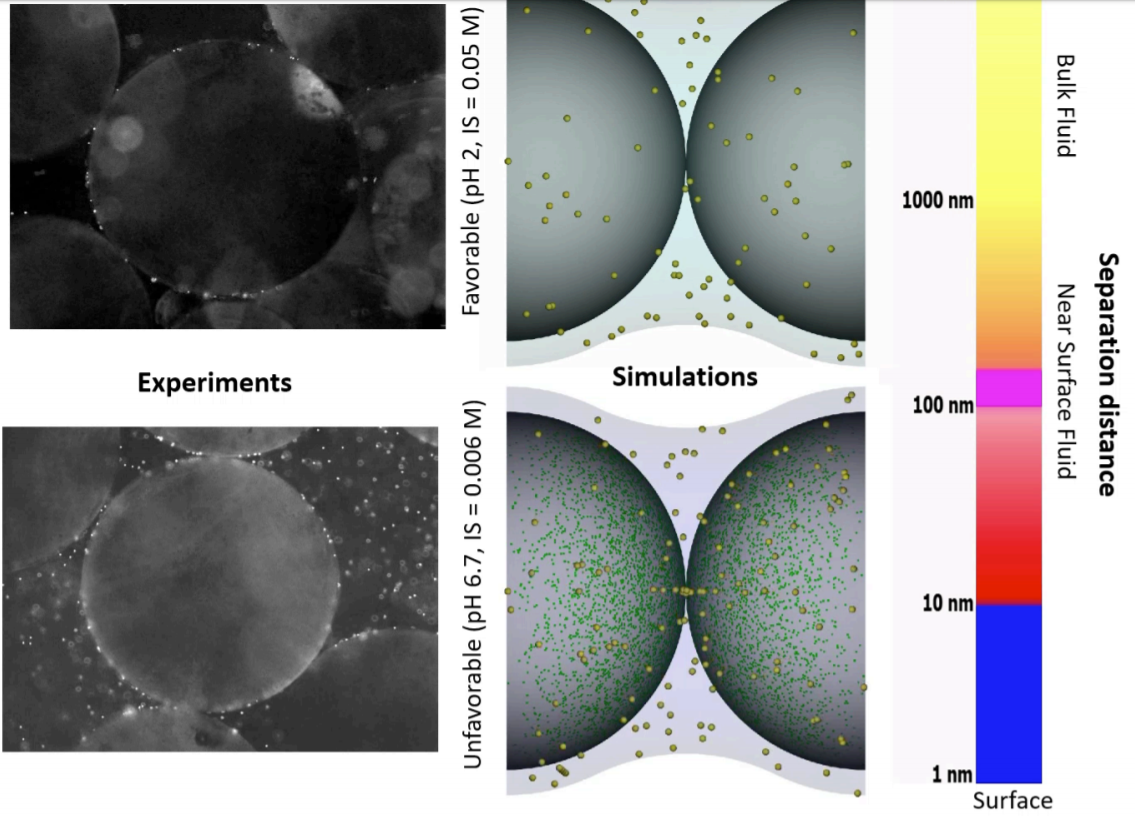
Nanoscale Heterogeneity in Models Helps Predict Macroscale Colloid Transport
By Bill Johnson
Department of Geology and Geophysics, University of Utah
These images show experiments (left) and simulations (right) of colloid attachment to a sediment gradient under favorable (top) and unfavorable (bottom) attachment conditions. The experimental images depict polystyrene latex spheres the size of E. coli bacteria flowing past glass beads half a millimeter in diameter.

CHPC Protected Environment
Health science research projects often require access to restricted data in a large scale computing environment, necessitating an environment where this work can be done securely. In 2009, CHPC collaborated with groups from the University of Utah's Department of Biomedical Informatics, working with the university's Information Security and Compliance offices, to develop a prototype protected environment (PE) framework to provide a secure and compliant computing environment for this work. This prototype has been very successful and has grown in scope. The original PE included an HPC cluster, storage, a dedicated statistics Windows server, and a VM farm. You can read about the original PE in the Journal of the American Medical Informatics Association. CHPC isolated this protected environment in the secured University of Utah Downtown Data Center and set up a network protected logical partition that provided research groups specific access to individual data sets. As the environment and technology developed, CHPC added additional security features such as two-factor authentication for entry and audit/monitoring.
CHPC, through the award of an NIH Shared Instrumentation Grant in April 2017, replaced this prototype environment with a larger, more secure environment—and one that is scalable and expandable such that it will be capable of providing a platform for the next generation of NIH computations research. Along with the original components listed above, the refreshed PE has expanded capabilities including high-speed data transfer, built-in disk encryption, additional security and log analyses including a SIEM solution, and an integrated archive service based on a software encrypted Ceph object-store. The new PE is supporting not only the previous usage modalities, but is also securely supporting projects involving human genomic data, as well as new collaborative efforts working to combine genomics with clinical EMR and PHI data, data from the Utah Population Database, and other data to enable personalized medicine research.
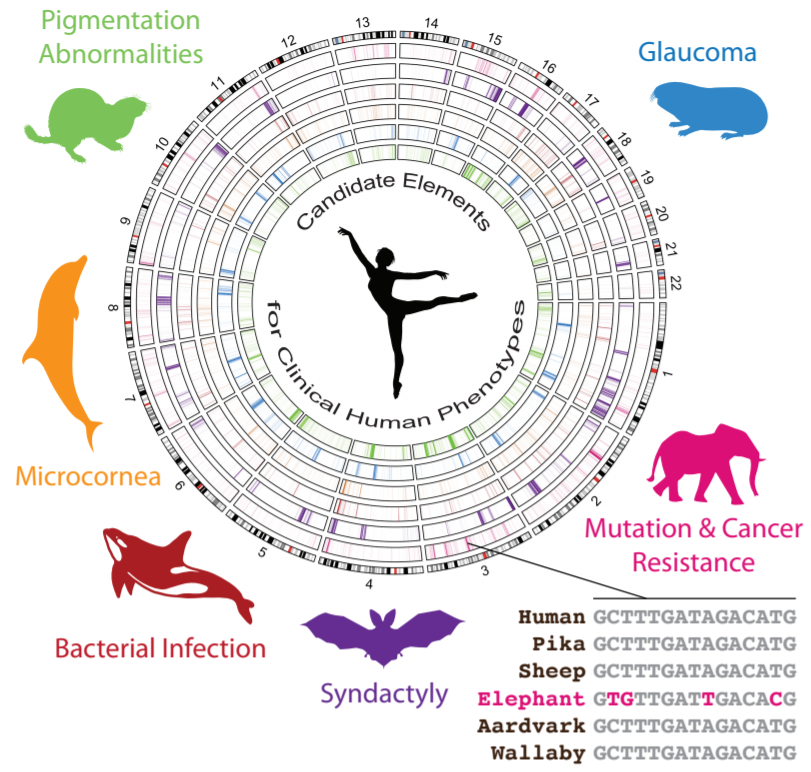
Accelerated Evolution in Distinctive Species Reveals Candidate Elements for Clinically Relevant Traits, Including Mutation and Cancer Resistance
By Elliott Ferris, Lisa M. Abegglen, Joshua D. Schiffman, Christoper Gregg
Gregg Lab, Department of Neurobiology & Anatomy, University of Utah
Our lab used CHPC resources to identify regions in animal genomes associated with their unique traits. We identified, for example, candidate regulatory elements in the elephant genome that may contribute to elephant cells' increased resistance to mutations and cancer.
We start by identifying regions of the mammalian genome that have changed little over millions of years of evolution in most mammals. This lack of change suggests that these are functional elements under negative selective pressure. We then test these regions for a specific lineage. We found a few thousand regions accelerated in each studied lineage including elephants. The gene associated with the largest number of elephant accelerated regions is a gene called FANCL involved in DNA repair. This is consistent with the elephant having DNA repair mechanisms that are expected to be more efficient than those of smaller animals; the accelerated regions we discovered may contribute to regulating genes like FANCL in ways that are distinctive to the elephant and import for its higher mutation resistance. Further study of these regions could lead us to better cancer treatments for humans. We performed experiments with elephant lymphocytes that further supported our findings.
See the article in Cell Reports.
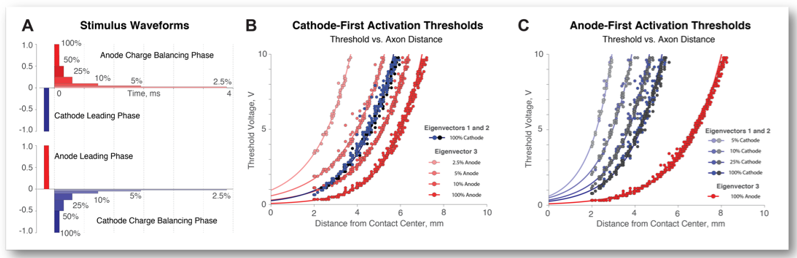
Anodic Stimulation Misunderstood: Preferential Activation of Fiber Orientations with Anodic Waveforms in Deep Brain Stimulation
By Daria Nesterovich Anderson1,2, Gordon Duffley1,2, Johannes Vorwerk, PhD2, Alan "Chuck" Dorval, PhD1, Christopher R. Butson, PhD1–4
1Department of Biomedical Engineering, 2Scientific Computing & Imaging (SCI) Institute, 3Departments of Neurology and Neurosurgery, 4Department of Psychiatry, University of Utah
Hypothesis: Fiber orientation influences activation thresholds and fiber orientations can be selectively targeted with DBS waveforms.
Deep Brain Stimulation (DBS) is an established surgical intervention for movement disorders and a growing treatment option for psychiatric disorders. Cathodic stimulation is primarily used in clinical DBS applications. Axons are understood to be more excitable during cathodic stimulation, and many studies report larger anodic thresholds compared to cathodic thresholds1. The activation function—second derivative of electric potential across nodes of Ranvier—can be used to approximate neural activation in response to extracellular electrical stimulation2. Positive second derivatives correspond to sites of action potential initiation.
Cathodic stimulation and anodic stimulation each activate ceratin fiber orientations selectively. The likelihood that a particular fiber orientation will induce firing depends on the sign and the magnitude of the activating function.
1. RattayF. 1986. Analysis of models for external stimulations of axons. IEEE Trans
Biomed Eng,33:974-977
2. Ranck JB. 1975. which elements are excited in electrical stimulation of mammalian
central nervous system: Areview. BrainRes. Nov 21;98(3):417-40
The Activating Function Based Volume of Tissue Activated (VTA)
By Gordon Duffley1,2, Daria Nesterovich Anderson1,2, Johannes Vorwerk, PhD2, Alan "Chuck" Dorval, PhD1, Christopher R. Butson, PhD1-4
1Department of Biomedical Engineering, 2Scientific Computing & Imaging (SCI) Institute, 3Departments of Neurology and Neurosurgery, 4Department of Psychiatry, University of Utah
Computational models of the volume of tissue activated (VTA) are commonly used both clinically and for research. Because of the computational demands of the traditional axon model approach, alternative approaches to approximate the VTA have been developed. The goal of this study is to evaluate multiple approaches of calculating approximations of the VTA for monopolar and bipolar stimulations on cylindrical and directional lead designs.
Activating function and electric field norm threshold values were dependent on stimulation amplitude, electrode configuration, and pulse width. All methods resulted in highly similar approximations of the VTA for monopolar stimulation for both the directional the cylindrical DBS lead designs. For bipolar stimulation, the axon model method and AF(Max, Tang) produced similar approximations of the VTA. For bipolar stimulation, AF(GP, Max) produced an approximation of the VTA that was larger than any of the other methods. AF(GP, Max) is not biased by only using tangentially oriented axons, unlike the axon model method and AF(Max, Tang).
Read the paper in the Journal of Neural Engineering.
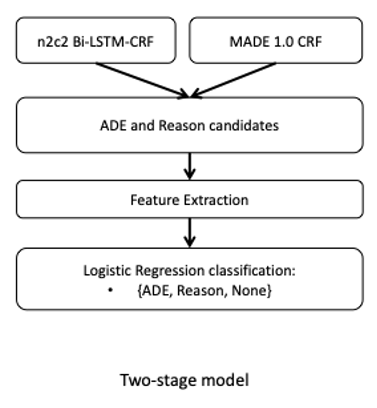
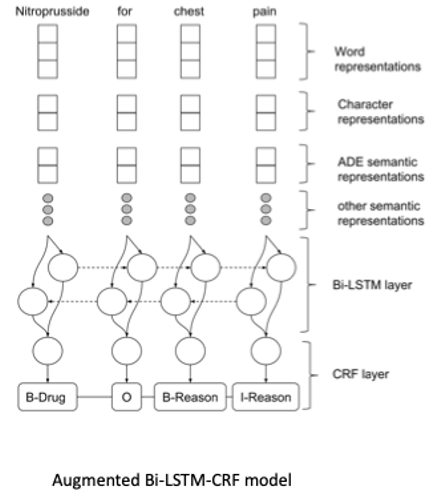
Hybrid Models for Medication and Adverse Drug Events Extraction
By Keely Peterson1,4, Jianlin Shi2, Alec Chapman3, Hannah Eyre1,4,5, Heather Lent1,4, Kevin Graves2, Jianyin Shao2, Subhadeep Nag2, Olga Patterson1,2,4, John F. Hurdle2
1Division of Epidemiology, Department of Internal Medicine; 2Department of Biomedical Informatics, University of Utah 3Health Fidelity, San Mateo, CA; 4VA Salt Lake City Health Care System; 5School of Computing, University of Utah
This is the abstract for our solution of the National NLP Clinical Challenges (n2c2) track 2. The goal is to identify drugs and drug-related adverse events from the clinical notes. This track includes 9 types of entities and 8 types of relations to be identified. We used two different models to complete the NER tasks and one model for the relation task. We ranked the 8th in the NER task, the 2nd place in the relation task, and the 5th in the end-to-end task.
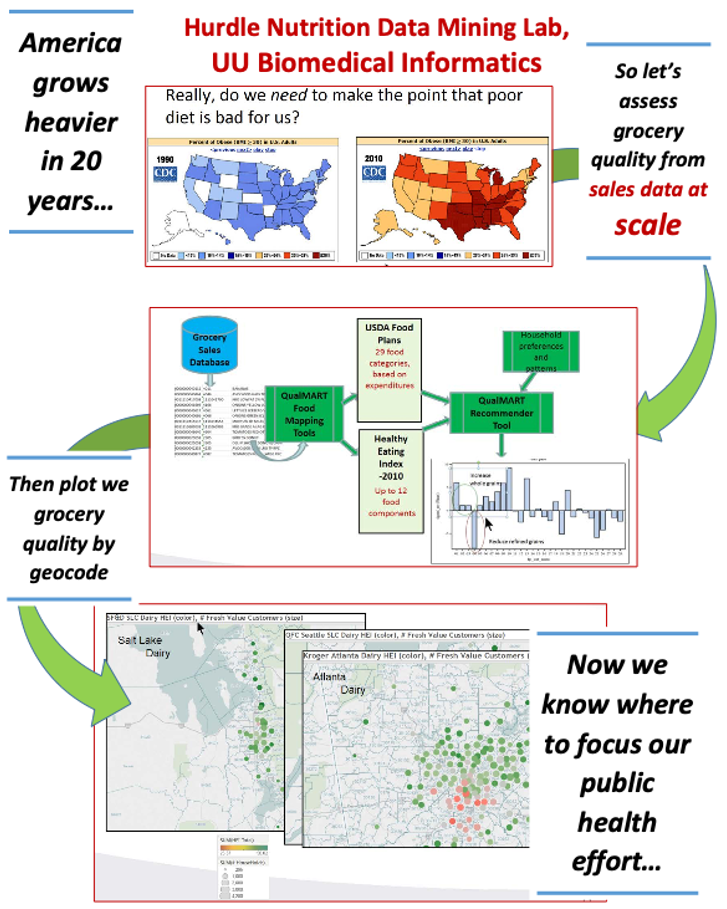
Nutrition Data Mining
By John F. Hurdle, MD, PhD. Professor
Department of Biomedical Informatics, University of Utah
We can process massive amounts of grocery sales data, run the data through a grocery food quality model, and use those results to figure out where we need to focus efforts to improve dietary health. Not your mother's supercomputer project, but we could not have done it without CHPC!
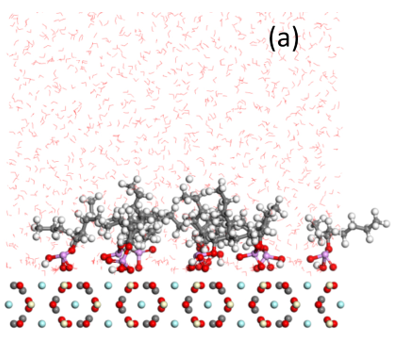
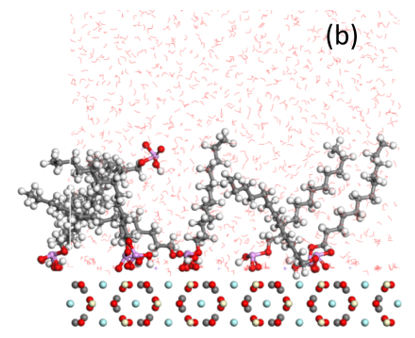
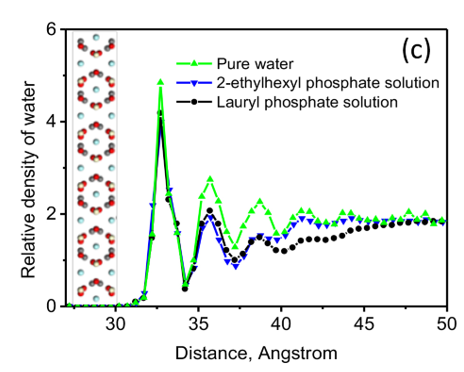
Phosphate adsorption by bastnaesite
By Weiping Liu, Xuming Wang, and Jan D. Miller
Department of Metallurgical Engineering, University of Utah
Bastnaesite is a major mineral resource of importance in the production of rare earth materials. Present flotation practice uses a reagent schedule which typically includes fatty acid of hydroxamic acid as collector. Initial evaluation suggests that phosphate collectors should be a promising collector for bastnaesite flotation. In this regard, the adsorption of phosphate collectors by bastnaesite was examined by Molecular Dynamics Simulations. The phosphate collectors were found to be adsorbed at the bastnaesite (100) surface, specifically, with the phosphate groups in preferred positions with respect to cerium atoms in the crystal structure, as shown in (a) and (b). This phenomenon agrees with the thermodynamic analysis and density functional theory calculation results. Furthermore, the 2-Ethylhexyl phosphate is adsorbed on the bastnaesite surface totally by the polar headgroup, while lauryl phosphate is adsorbed on the bastnaesite surface by the combination of headgroup and hydrophobic attraction between adjacent hydrocarbon chains. However, lauryl phosphate excludes more water due to its longer hydrocarbon chain, thereby imparting higher hydrophobicity compared to the case of 2-Ethylhexyl phosphate as shown in (c). It is expected that the results of this research will enable us to further understand the bastnaesite flotation chemistry using phosphate collectors, with consideration of chemical structure, which includes the hydrophobic surface state, selectivity in flotation, and adsorption phenomena for the sign of alkyl phosphate collector.
A generic rule-based pipeline for patient cohort identification
By Jianlin Shi1, Jianyin Shao1, Kevin Graves1, Celena Peters1, Kelly Peterson2, John F Hurdle1
1Department of Biomedical Informatics, 2Division of Epidemiology, University of Utah
Our aim is a one-for-all pipeline based on a use-friendly rule design app. We identify the patient cohort with high risk of heart disease for clinical trial from clinical notes with 13 heterogeneous selection criteria.
Our pipeline is demonstrated to be effective and suitable for rapid development of patient cohort identification solutions.
For more information about algorithms, see a related article in the Journal of Biomedical Informatics.
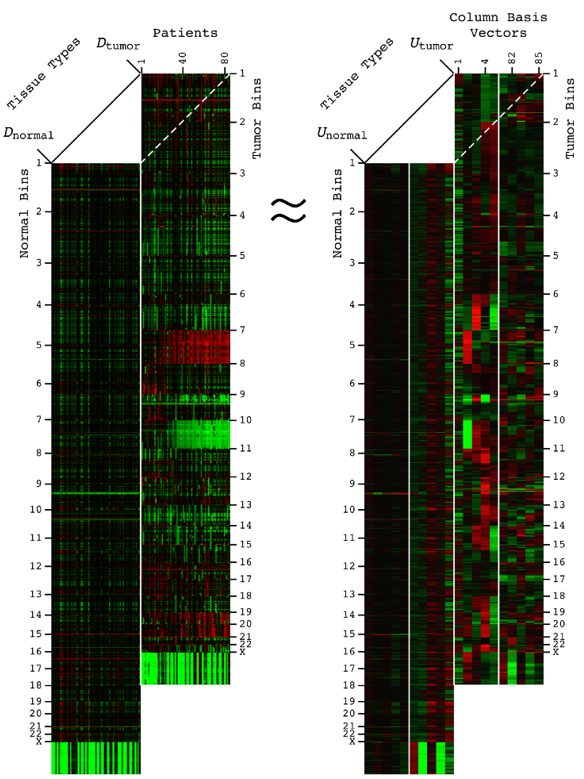
Comparative spectral decompositions, such as the GSVD, underlie a mathematically universal description of the genotype-phenotype relations in cancer
By Katherine A. Aiello1,2, Sri Priya Ponnapalli1, and Orly Alter1,2,3
1Scientific Computing and Imaging Institute, 2Department of Bioengineering, 3Huntsman Cancer Institute and Department of Human Genetics, University of Utah
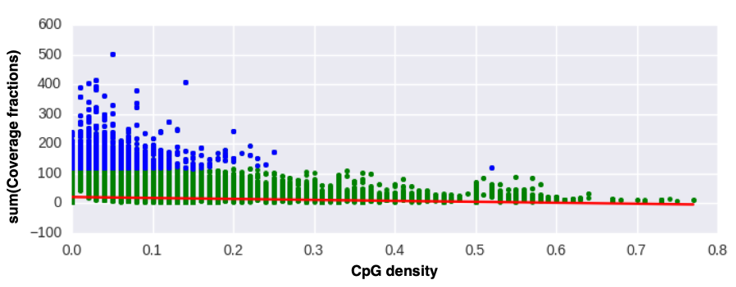
Abstract: DNA alterations have been observed in astrocytoma for decades. A copy-number genotype predictive of a survival phenotype was only discovered by using the generalized singular value decomposition (GSVD) formulated as a comparative spectral decomposition. Here, we use the GSVD to compare whole-genome sequencing (WGS) profiles of patient-matched astrocytoma and normal DNA. First, the GSVD uncovers a genome-wide pattern of copy-number alterations, which is bounded by patterns recently uncovered by the GSVDs of microarray-profiled patient-matched glioblastoma (GBM) and, separately, lower-grade astrocytoma and normal genomes. Like the microarray patterns, the WGS pattern is correlated with an approximately one-year median survival time. By filling in gaps in the microarray patterns, the WGS pattern reveals that this biologically consistent genotype encodes for transformation via the Notch together with the Ras and Shh pathways. Second, like the GSVDs of the microarray profiles, the GSVD of the WGS profiles separates the tumor-exclusive pattern from normal copy-number variations and experimental inconsistencies. These include the WGS technology-specific effects of guanine-cytosine content variations across the genomes that are correlated with experimental batches. Third, by identifying the biologically consistent phenotype among the WGS-profiled tumors, the GBM pattern proves to be a technology-independent predictor of survival and response to chemotherapy and radiation, statistically better than the patient's age and tumor's grade, the best other indicators, and MGMT promoter methylation and IDH1 mutation. We conclude that by using the complex structure of the data, comparative spectral decompositions underlie a mathematically universal description of the genotype-phenotype relations in cancer that other methods miss.
Read the article in APL Bioengineering.
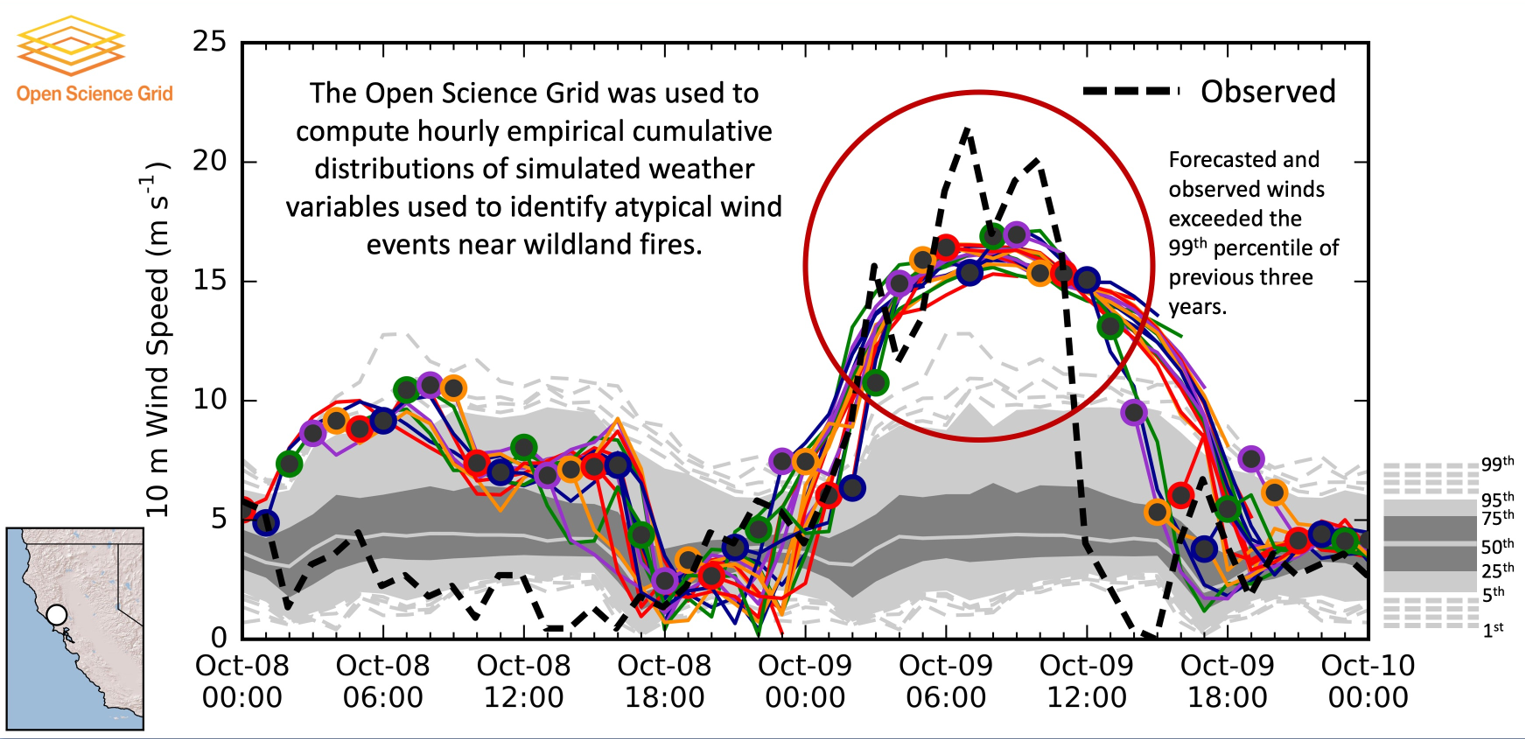
Pando Object Storage Archive Supports Weather Research
By Brian K. Blaylock1, John D. Horel1&2, Chris Galli1&2
1Department of Atmospheric Sciences, University of Utah; 2Synoptic Data, Salt Lake City, Utah
Terabytes of weather data are generated every day by gridded model simulations and in situ and remotely sensed observations. With this accelerating accumulation of weather data, efficient computational solutions are needed to process, archive, and analyze the massive datasets. The Open Science Grid (OSG) is a consortium of computer resources around the United States that makes idle computer resources available for use by researchers in diverse scientific disciplines. The OSG is appropriate for high-throughput computing, that is, many parallel computational tasks. This work demonstrates how the OSG has been used to compute a large set of empirical cumulative distributions from hourly gridded analyses of the High-Resolution Rapid Refresh (HRRR) model run operationally by the Environmental Modeling Center of the National Centers for Environmental Prediction. The data is being archived within Pando, an archive named after the vast stand of aspen trees in Utah. These cumulative distributions derived from a 3-yr HRRR archive are computed for seven variables, over 1.9 million grid points, and each hour of the calendar year. The HRRR cumulative distributions are used to evaluate near-surface wind, temperature, and humidity conditions during two wildland fire episodes—the North Bay fires, a wildfire complex in Northern California during October 2017 that was the deadliest and costliest in California history, and the western Oklahoma wildfires during April 2018. The approach used here illustrates ways to discriminate between typical and atypical atmospheric conditions forecasted by the HRRR model. Such information may be useful for model developers and operational forecasters assigned to provide weather support for fire management personnel.
Read the article in the Journal of Atmospheric and Oceanic Technology.
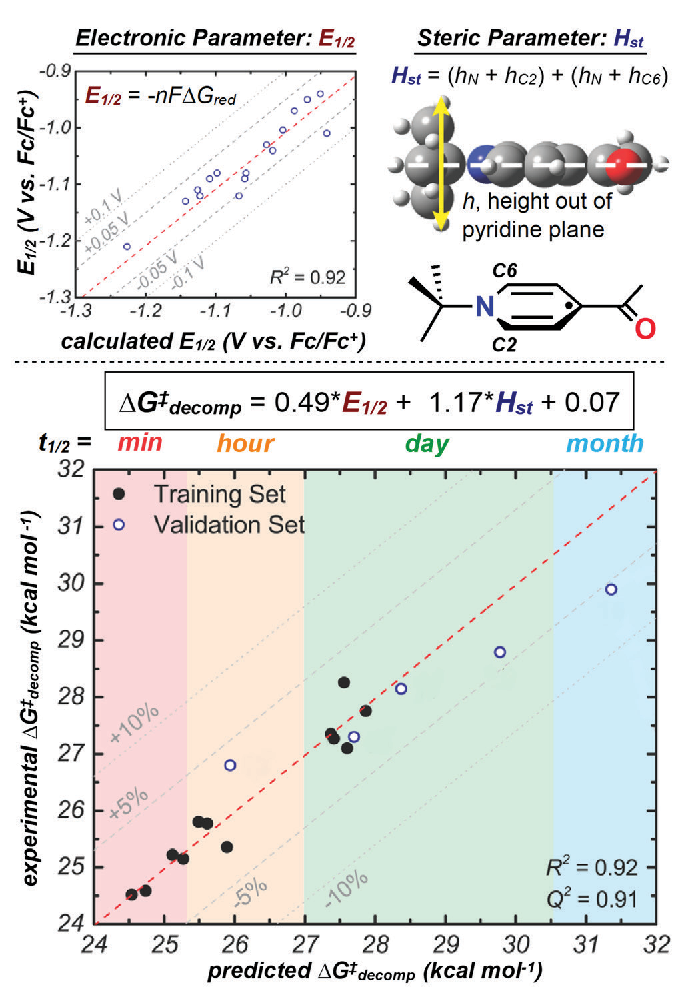
Applying Modern Tools of Data Analysis to Current Challenges in Chemistry
By Jacquelyne Read and Matthew Sigman
Department of Chemistry, University of Utah
What if there were no such thing as "bad data"? In this case, we are not referring to the quality of the data, but the experimental outcome. In the field of asymmetric catalysis, a flourishing area in organic chemistry, a central goal is to develop reactions are able to form one enantiomer (a chiral molecule which has a non-superimposable mirror image) of product in preference to the other enantio-mer possible. A helpful analogy to understand the concept of enantiomers is the right and left hand—mirror images, but not identical. Enantioselective reactions have many important applications, such as the more efficient synthesis of drug molecules, which often need to be made as just one enantiomer because different enantiomers sometimes result in drastically different biological responses. Often, when enantioselective reactions are published, only data meeting or exceeding the gold standard of 95% desired enantiomer to 5% undesired enantiomer are reported. This results in useful, but non-optimal, data never being published.
The Sigman lab takes a different approach. We seek to make use of a wider range of data collected during the reaction optimization process because results showing low enantioselectivity and high enantioselectivity can be equally information-rich and help us learn about a given reaction. Our workflow involves collecting molecular properties (such as size, shape, and electronic nature) relevant to a reaction we seek to study. These properties are then used as parameters in a multivariable linear regression algorithm and correlated to the experimentally determined reaction selectivity. The resulting equations are applied to the prediction of molecules should lead to higher (and sometimes lower) enantioselectivity, which are then synthesized and validated experimentally. Ultimately, a deeper understanding of the reaction can be garnered through analysis of the statistical model. This workflow has been successfully applied to reaction properties beyond enantioselectivity, such as regioselectivity (where a reaction occurs on a given molecule) and rates of chemical processes, which will be discussed further in the examples below [in the original newsletter article]. Central to our technology is the calculation of molecular properties using density functional theory (DFT), which is accomplished using the computational resources of the CHPC, among others.
Read more in the Spring 2019 newsletter.
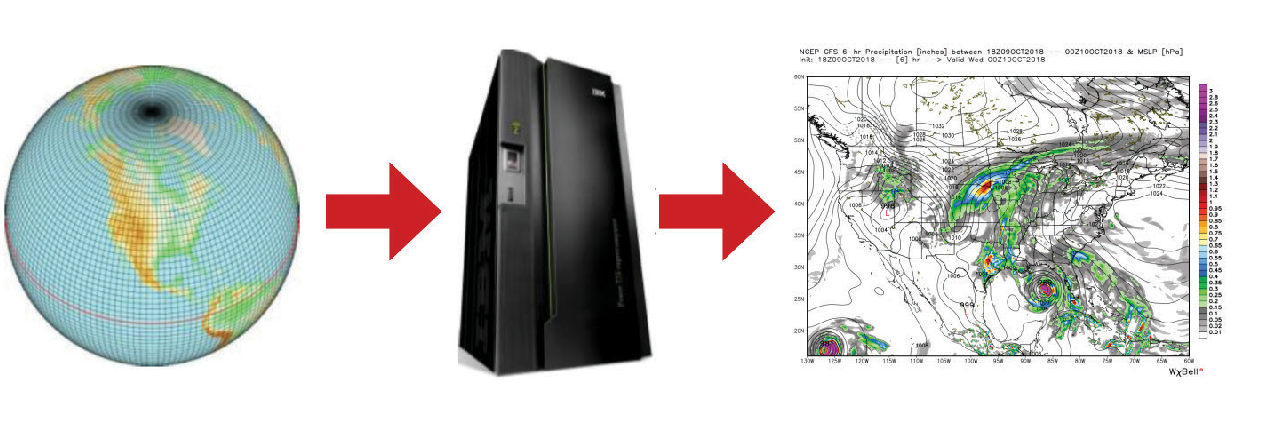
Enabling Innovation in Numerical Prediction of High-Impact Weather Systems
By Zhaoxia Pu
Department of Atmospheric Sciences, University of Utah
Along with the rapid advancement in computer technology, numerical weather prediction (NWP) has become a central component of modern weather forecasting. In the United States, daily weather forecasting begins with a supercomputer at the National Oceanic and Atmospheric Administration in Washington, DC. Around the world, most countries use NWP as key guidance for their operational weather prediction.
At the University of Utah, high-performance computing has wholly or partially supported essential research projects on NWP with innovative science and technology advancements. Dr. Zhaoxia Pu, professor of the Department of Atmospheric Sciences, and her research group devote studies to improving numerical prediction and understanding of high-impact weather systems, including tropical cyclones, hurricanes, mesoscale convective systems, mountainous fog, and flows over complex terrain. For most of the research, hundreds and sometimes thousands of CPU processors are used for a single set of numerical experiments.
Read more in the Fall 2018 newsletter.
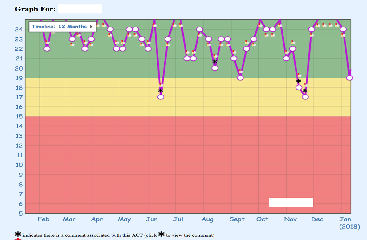
e-Asthma Tracker
By Eun Hea Unsicker, Kelsee Stromberg, Flory Nkoy, Namita Mahtta, and Bryan Stone,
Department of Pediatrics, University of Utah
With funding from the Agency for Healthcare Research and Quality (AHRQ), our team developed a paper-based Asthma Tracker to help families manage their asthma better at home. The Asthma Tracker utilizes the Asthma Control Test (ACT), a widely used asthma questionnaire, was previously validated to assess a patient's asthma control levels on a monthly basis. Our team received permission to modify the ACT, to add graphs with recommendations, and to validate it to be used weekly (in children 12–18 years and for proxy use by parents of younger children 2–12 years of age) as part of Asthma Tracker. The Asthma Tracker graphs provide weekly asthma control scores (ranging from 5–25) displayed longitudinally, separated into three zones: Red (poorly controlled), Yellow (not well controlled), and Green (well controlled). Asthma Tracker provides recommendations depending on which zone they fall in each week to help patients avoid an exacerbation. Our studies suggest Asthma Tracker, its graphical output, and recommendations are relatively sensitive at detecting deterioration in asthma control well before it becomes serious, allowing the child's healthcare provider to intervene early and prevent worsening loss of control.
Read more in the Summer 2018 newsletter.
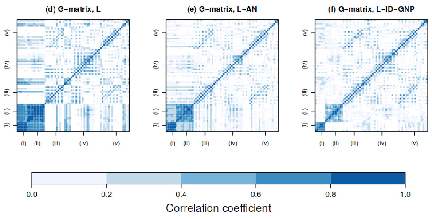
Predicting Trait Values and Evolutionary Change from DNA Sequences
By Zachary Gompert
Department of Biology, Utah State University
How predictable is evolution? This question has been asked and answered in various ways. Studies of parallel and convergent evolution have shown species can predictably evolve similar phenotypes in response to similar environmental challenges, and this sometimes even involves the same genes or mutations. On the other hand, scientists have argued major external phenomena, such as cataclysmic meteor strikes and climate cycles, render long-term patterns of evolution unpredictable. Thus, evolution can be predictable to different degrees depending on the scale and specific features one is interested in.
The Gompert lab at Utah State University thinks a lot about predictability, both in terms of the predictability of evolution, and in terms of predicting phenotypes (i.e., trait values) from genetic/genomic data. In other words, we want to be able to predict traits from genes, and to predict how such traits and the underlying gene/allele frequencies change. And when we can't do these things, we want to understand why. Our work often relies on computationally intensive statistical modelling and simulations, which we use both to develop theory and to fit models. This requires access to large numbers of compute nodes, and in some cases large amounts of memory, substantial disk space and long-running jobs, all of which have been made possible by USU's partnership with the University of Utah CHPC.
Read more in the Spring 2018 newsletter.
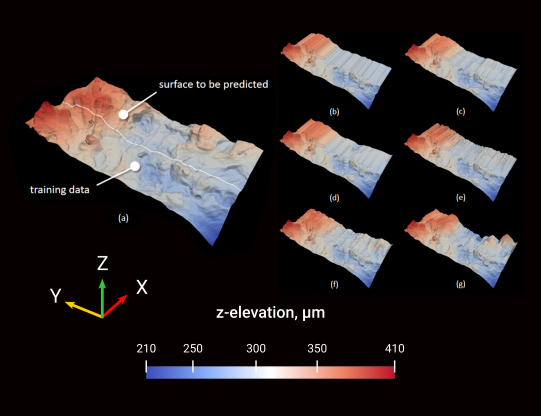
Modernizing the Field of Fracture Mechanics through High-Fidelity Modeling, Data-Driven Science, and Machine Learning
By Ashley Spear
Multiscale Mechanics & Materials (MMM) Lab, Department of Mechanical Engineering, University of Utah
Cracks are mysterious and have haunted materials scientists and design engineers for at least a century. At the smallest length scales, cracks are born when atomic bonds break to create new surface area that previously did not exist. Of course, we generally do not notice cracks until they are much, much larger than the atomic scale. Often, cracks are regarded as being detrimental to the integrity of structures (e.g., aircrafts, biomedical implants, civil infrastructure); on the other hand, there are many scenarios where the ultimate goal is to cause cracking (e.g., opening household items like soda cans, wood splitting, hydraulic fracturing). For critical, high-stakes applications, being able to predict when and where cracks will form and how quickly they will grow is necessary to estimating the safety, reliability, and cost-effectiveness of both new and existing technologies. Making these kinds of predictions is central to the field of fracture mechanics.
With access to computational resources through the CHPC, the Multiscale Mechanics & Materials Lab is working to modernize the field of fracture mechanics. Through the development and use of sophisticated, high-fidelity numerical modeling, data-driven science, and machine learning, we have been working to address some of the most fundamental questions concerning the origins and propagation of small cracks in engineering materials.
Read more in the Summer 2019 newsletter.

Using Computation to Sort Through Billions of Single-Nucleotide Polymorphism Pairs Rapidly
By Randall Reese1,2, Xiaotian Dai2, and Guifang Fu2
1Idaho National Laboratory, Department of Mathematics and Statistics, 2Utah State University
The interaction between two statistical features can play a pivotal role in contributing to the variation of the response, yet the computational feasibility of screening for interactions often acts as an insurmountable barrier in practice. We developed a new interaction screening procedure which is significantly more tractable computationally. Using the supercomputing resources of the CHPC, we were able to apply our method to a data set containing approximately 11 billion pairs of single nucleotide polymorphisms (SNPs). The goal of this analysis was to ascertain which pairs of SNPs were most strongly associated with the likelihood of a human female developing polycystic ovary syndrome. This distributed computing process allowed us to select in just over two days a set of around 10,000 SNP interaction pairs which factor most strongly into the response. What may have previously taken several weeks (or months) to obtain now took less than three days. We concluded our analysis by using an implementation of multi-factor dimension reduction (MDR) on the previously aforementioned results.

Weather Classification using Machine Learning
By Greg Furlich
Telescope Array Collaboration, University of Utah
The Telescope Array (TA) cosmic ray observatory located in Millard County, Utah is the largest cosmic ray observatory in the northern hemisphere. It operates 507 surface detectors and 3 Fluorescence Detector (FDs) sites, Black Rock (BR), Long Ridge (LR), and Middle Drum (MD) to detect ultra high energy cosmic rays (UHECR). The FDs operate on clear, moonless nights to best observe the cosmic ray Extensive Air Shower that excites the Nitrogen in the atmosphere. However, sometimes the detector operates when the night is cloudy and this affects the scattering fluorescence light in the atmosphere diminishing our ability to properly reconstruct or simulate the cosmic ray event. In order to flag and remove cloudy weather from the FD data, neural networks were trained on snapshots of the night sky created using the FADC pedestals of each PMT at BR. Starting with simple neural networks and building up complexity, we were able to achieve high accuracy of weather classification and classifying each part allows for better time resolution of the operation night's weather progression.

Optimization of Supercomputing Techniques to Compute Opto-electronic Energetics of Catalysts
By Alex Beeston, Caleb Thomson, Ricardo Romo, D. Keith Roper
Department of Biological Engineering, Utah State University
Electromagnetic spectra of catalytic particles can be compared using the Discrete Dipole Approximation (DDA) to simulate the optoelectronic energies of noble metal catalysts. However, DDA requires heavy computational power to generate results in reasonable amounts of time. In this study, simulations of the opto-electronic energies of nano-scale spheres catalysts represented by sets of platinum dipoles in varying levels of resolution are performed using DDA to examine the effect of input size on run time.
DDA was performed in this study by downloading and compiling source code, generating target and parameter files, submitting jobs via SLURM scheduling, and visualizing results. Fast running times of DDA enables more opportunity to examine the opto-electronic behavior of more catalysts, and rational design and fabrication of optimally distributed catalyst particles could eventually transform the activity and economics of chemical and biochemical reactions.
Running the samples in parallel produced minor decreases in running time for only the samples with an input size of at least 65,267 dipole points. For sample sizes less than or equal to 33,401, the running time either increased slightly or did not change by wing parallel processing.

Materializing the Air Quality Exposome
By Ramkiran Gouripeddi, MBBS, MS1,2, Mollie Cummins, PhD, RN, FAAN, FACMI1,2,3, Julio Facelli, PhD, FACMI1,2, Katherine Sward, PhD, RN, FAAN1,2,3
1Department of Biomedical Informatics, 2Center for Clinical and Translational Science, 3College of Nursing, University of Utah
Comprehensive quantification of effects of the modern environment on health requires taking into account data from all contributing environmental exposures (exposome) spanning:
•Endogenous processes within the body
•Biological responses of adaptation to environment
•Physiological manifestations of these responses
•Environmental measurements
•Socio-behavioral factors.
Materializing the concept of the exposome requires methods to collect, integrate and assimilate data accommodating variables patio-temporal resolutions:
•Wearable and stationary sensors
•Environmental monitors
•Personal activities
•Physiology
•Medication use and other clinical variables
•Genomic and other biospecimen-derived
•Person-reported
•Computational models,.
,

Structure of the Cdc48 segregase in the act of unfolding an authentic substrate
By Ian Cooney1, Han Han1, Michael G. Stewart1, Richard H. Carson2, Daniel T. Hanson1, Janet H. Iwasa1, John C. Price2, Christopher P. Hill1, Peter S. Shen1
1Department of Biochemistry, University of Utah, 2Department of Chemistry and Biochemistry, Brigham Young University
The cellular machine Cdc48 functions in multiple biological pathways by segregating its protein substrates from a variety of stable environments such as organelles or multi-subunit complexes. Despite extensive studies, the mechanism of Cdc48 has remained obscure, and its reported structures are inconsistent with models of substrate translocation proposed for other AAA+ ATPases (adenosine triphosphatases). Here, we report a 3.7-angstrom–resolution structure of Cdc48 in complex with an adaptor protein and a native substrate. Cdc48 engages substrate by adopting a helical configuration of substrate-binding residues that extends through the central pore of both of the ATPase rings. These findings indicate a unified hand-over-hand mechanism of protein translocation by Cdc48 and other AAA+ ATPases.

Analyzing the Differences in Neural Activation Between Conventional and Interleaving Deep Brain Stimulation of the Subthalamic Nucleus for Dyskinesia Suppression
By Gordon Duffley1,2, Camila C Aquino4, Christopher R. Butson, PhD1-3
1Department of Biomedical Engineering, 2Scientific Computing & Imaging Institute, 3Department of Neurology, Neurosurgery, and Psychiatry, University of Utah; 4Department of Health, Evidence, and Impact, McMaster University
Interleaving stimulation (ILS) is a form of deep brain stimulation (DBS) where two independent stimulation waveforms are delivered to the patient out of phase with each other. The goal of this study was to test the hypothesis that the therapeutic mechanism of STN ILS suppression of dyskinesias is the activation of the pallidothalamic tract, which travels from GPi through the Field H of Fields of Forel and innervates motor thalamus.

Structural Connectivity Predicts Clinical Outcomes of Deep Brain Stimulation for Tourette Syndrome
By K.A. Johnson, G. Duffley, D.N. Anderson, D. Servello, A. Bona, M. Porta, J.L. Ostrem, E. Bardinet, M.L. Welter, A.M. Lozano, J.C. Baldermann, J. Kuhn, D. Huys, T. Foltynie, M. Hariz, E.M. Joyce, L. Zrinzo, Z. Kefalopoulou, J.G. Zhang, F.G. Meng, C. Zhang, Z. Ling, X. Xu, X. Yu, A.Y.J.M. Smeets, L. Ackermans, V. Visser-Vandewalle, A.Y. Mogilner, M.H. Pourfar, A. Gunduz, W. Hu, K.D. Foote, M.S. Okun, C.R. Butson
It is unknown which networks should be modulated with Deep Brain Stimulation in order to improve tics or comorbid obsessive-compulsive behavior (OCB) in patients with Tourette Syndrome (TS).
In collaboration with the International TS DBS Registry and Database and the International Neuromodulation Registry, we aimed to:
1. Identify the structural networks that were correlated with improvements in tics or OCB after DBS targeted to different brain regions and identify the common networks involved across all surgical targets;
2. Determine which regions within the total volume of stimulation across patients may result in modulation of networks that were positively or negatively correlated with outcomes.

Selective Activation of Central Thalamic Pathways Facilitates Behavioral Performance in Healthy Non-Human Primates
By Andrew Janson1,2, Jonathan Baker4, Nicholas D. Schiff4, Christopher R. Butson1-3
Departments of Neurology, Neurosurgery, and Psychiatry, University of Utah; Brain and Mind Research Institute, Weill Cornell Medical College
Deep brain stimulation within the central thalamus (CT-DBS) has been proposed as a therapeutic strategy to improve arousal regulation and cognitive impairments in patients with severe brain injury. We hypothesized that fiber pathways in the central thalamus have a specific orientation, projecting to the cortex and striatum, which are robustly activated with stimulation configurations that facilitate behavioral performance and enhance cortical and striatal activity.

Early Biothreat Detection with Unsupervised Machine Learning
By Julia Lewis, Kelly Peterson, Wathsala Widanagamaachchi, Clifton Baker, Fangxiang Jiao, Chris Nielson, Makoto Jones (PI)
Department of Internal Medicine, University of Utah
We leverage neural network autoencoder models to rapidly detect biological events such as those following natural disasters. After training these models, they learn what is common in Emergency Department (ED) visits in Veterans Affairs medical centers. When the reconstruction distance is high they indicate that the visit is not common even if we do not know the diagnosis.
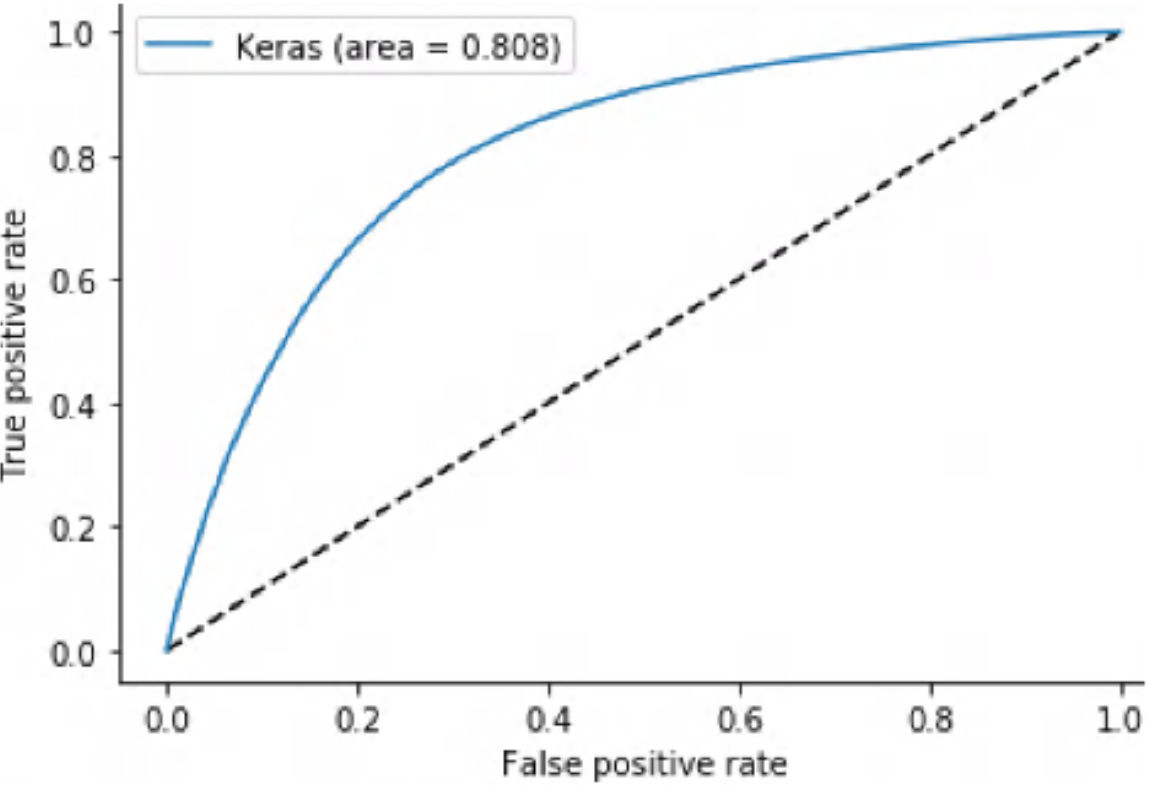
Using Supervised Machine Learning Classifiers to Estimate Likelihood of Participating in Clinical Research of a De-Identified Version of ResearchMatch
By Janette Vazquez1, Samir Abdelrahman1, Loretta Byrne2, Michael Russell2, Paul Harris2, Julio Facelli1
1Department of Biomedical Informatics, University of Utah; 2Vanderbilt University
Recruitment for clinical trials and interventional studies is critical for the evaluation of new pharmaceuticals, therapies, and devices. In a study conducted by the Center for Information and Study on Clinical Research Participation, while 80 % of people surveyed expressed a willingness to participate in clinical research, only about 1-2% of Americans participate in clinical trials annually. With the use of modern quantitative analytical methods like machine learning to determine if there is a relationship between participants' characteristics and the likelihood to participate in a clinical trial on data from ResearchMatch.
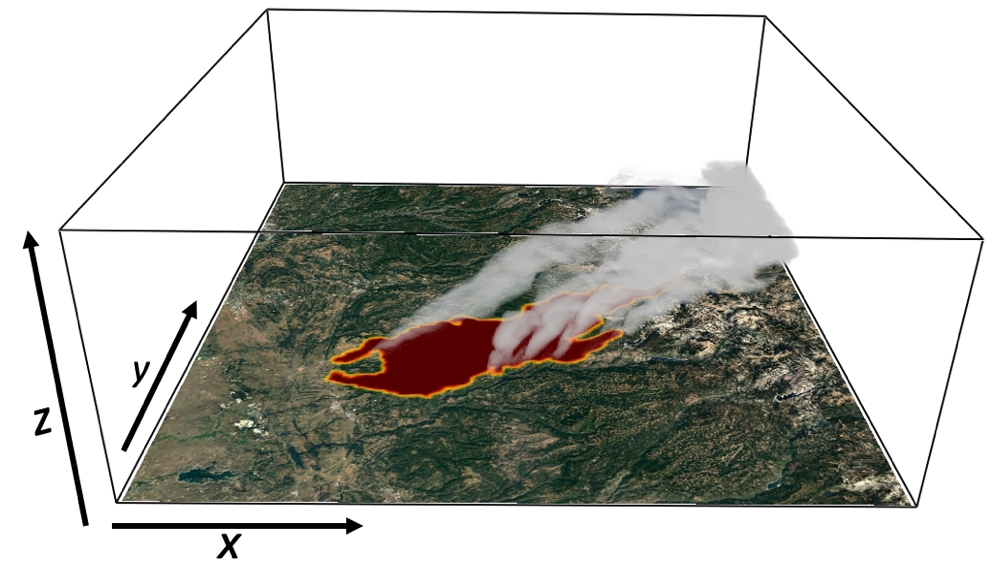
Smoke Forecasting With a Coupled Fire-Atmosphere Model
By Derek V. Mallia, Adam Kochanski
Department of Atmospheric Sciences, University of Utah, Department of Meteorology and Climate Sciences, San Jose State University
The number of large wildfires has been steadily increasing since the early 1980s, and it is suspected that wildfire smoke is responsible for deteriorating air quality across the western U.S. Wildfire intensity is projected to increase through the end of the 21st century due to climate change, which is increasing temperatures, exacerbating drought conditions, and accelerating springtime snow melt. Similarly, smoke emissions from wildfires are also expected to increase in the coming decades and will continue to deteriorate air quality across the western U.S. Wildfire smoke consists of small particulates with a diameter less than 2.5 microns (PM2.5), and secondary pollutants such as ozone, both of which can degrade air quality and be harmful when inhaled by humans. Across the globe, an estimated 3.3 million deaths per year can be linked to poor air quality. Smoke emitted from biomass burning is estimated to be responsible for 5% of all air quality related deaths.
Numerical weather prediction models are powerful tools that can forecast the future state of the atmosphere using mathematical equations that describe how air moves and how heat and moisture are exchanged throughout the atmosphere. Today, weather prediction models have evolved such that they can simulate meteorology with high fidelity and resolve meteorological phenomena at sub kilometer grid scales. Recent advances in computing technology has facilitated the development and deployment of a new generation of weather and fire forecasting tools; namely, coupled fire atmosphere models. Coupled fire atmosphere models can simultaneously forecast meteorology and wildfire growth. Coupled fire atmosphere models can also forecast fuel moisture conditions, which greatly influences fire growth rates and fire behavior, and chemical interactions between the smoke and other pollutants in the atmosphere.
For our studies we use WRF-SFIRE-CHEM, a state-of-the-art coupled fire atmosphere model integrated with chemistry, which couples the National Center of Atmospheric Research (NCAR)’s Weather Research and Forecast model (WRF-CHEM) with a fire spread model (SFIRE). The fire spread model within WRF-SFIRE accounts for the effects of wind, fuel moisture, fuel type, and slope on fire behavior. Further updates were made to WRF-SFIRE that allows the model to estimate smoke emissions based on the amount and type of vegetation that is consumed by the fire. Smoke emissions produced by the wildfire are then lofted upwards by the buoyant wildfire plume rise and detrained into the free atmosphere.
For more information, see our Fall 2021 newsletter here.
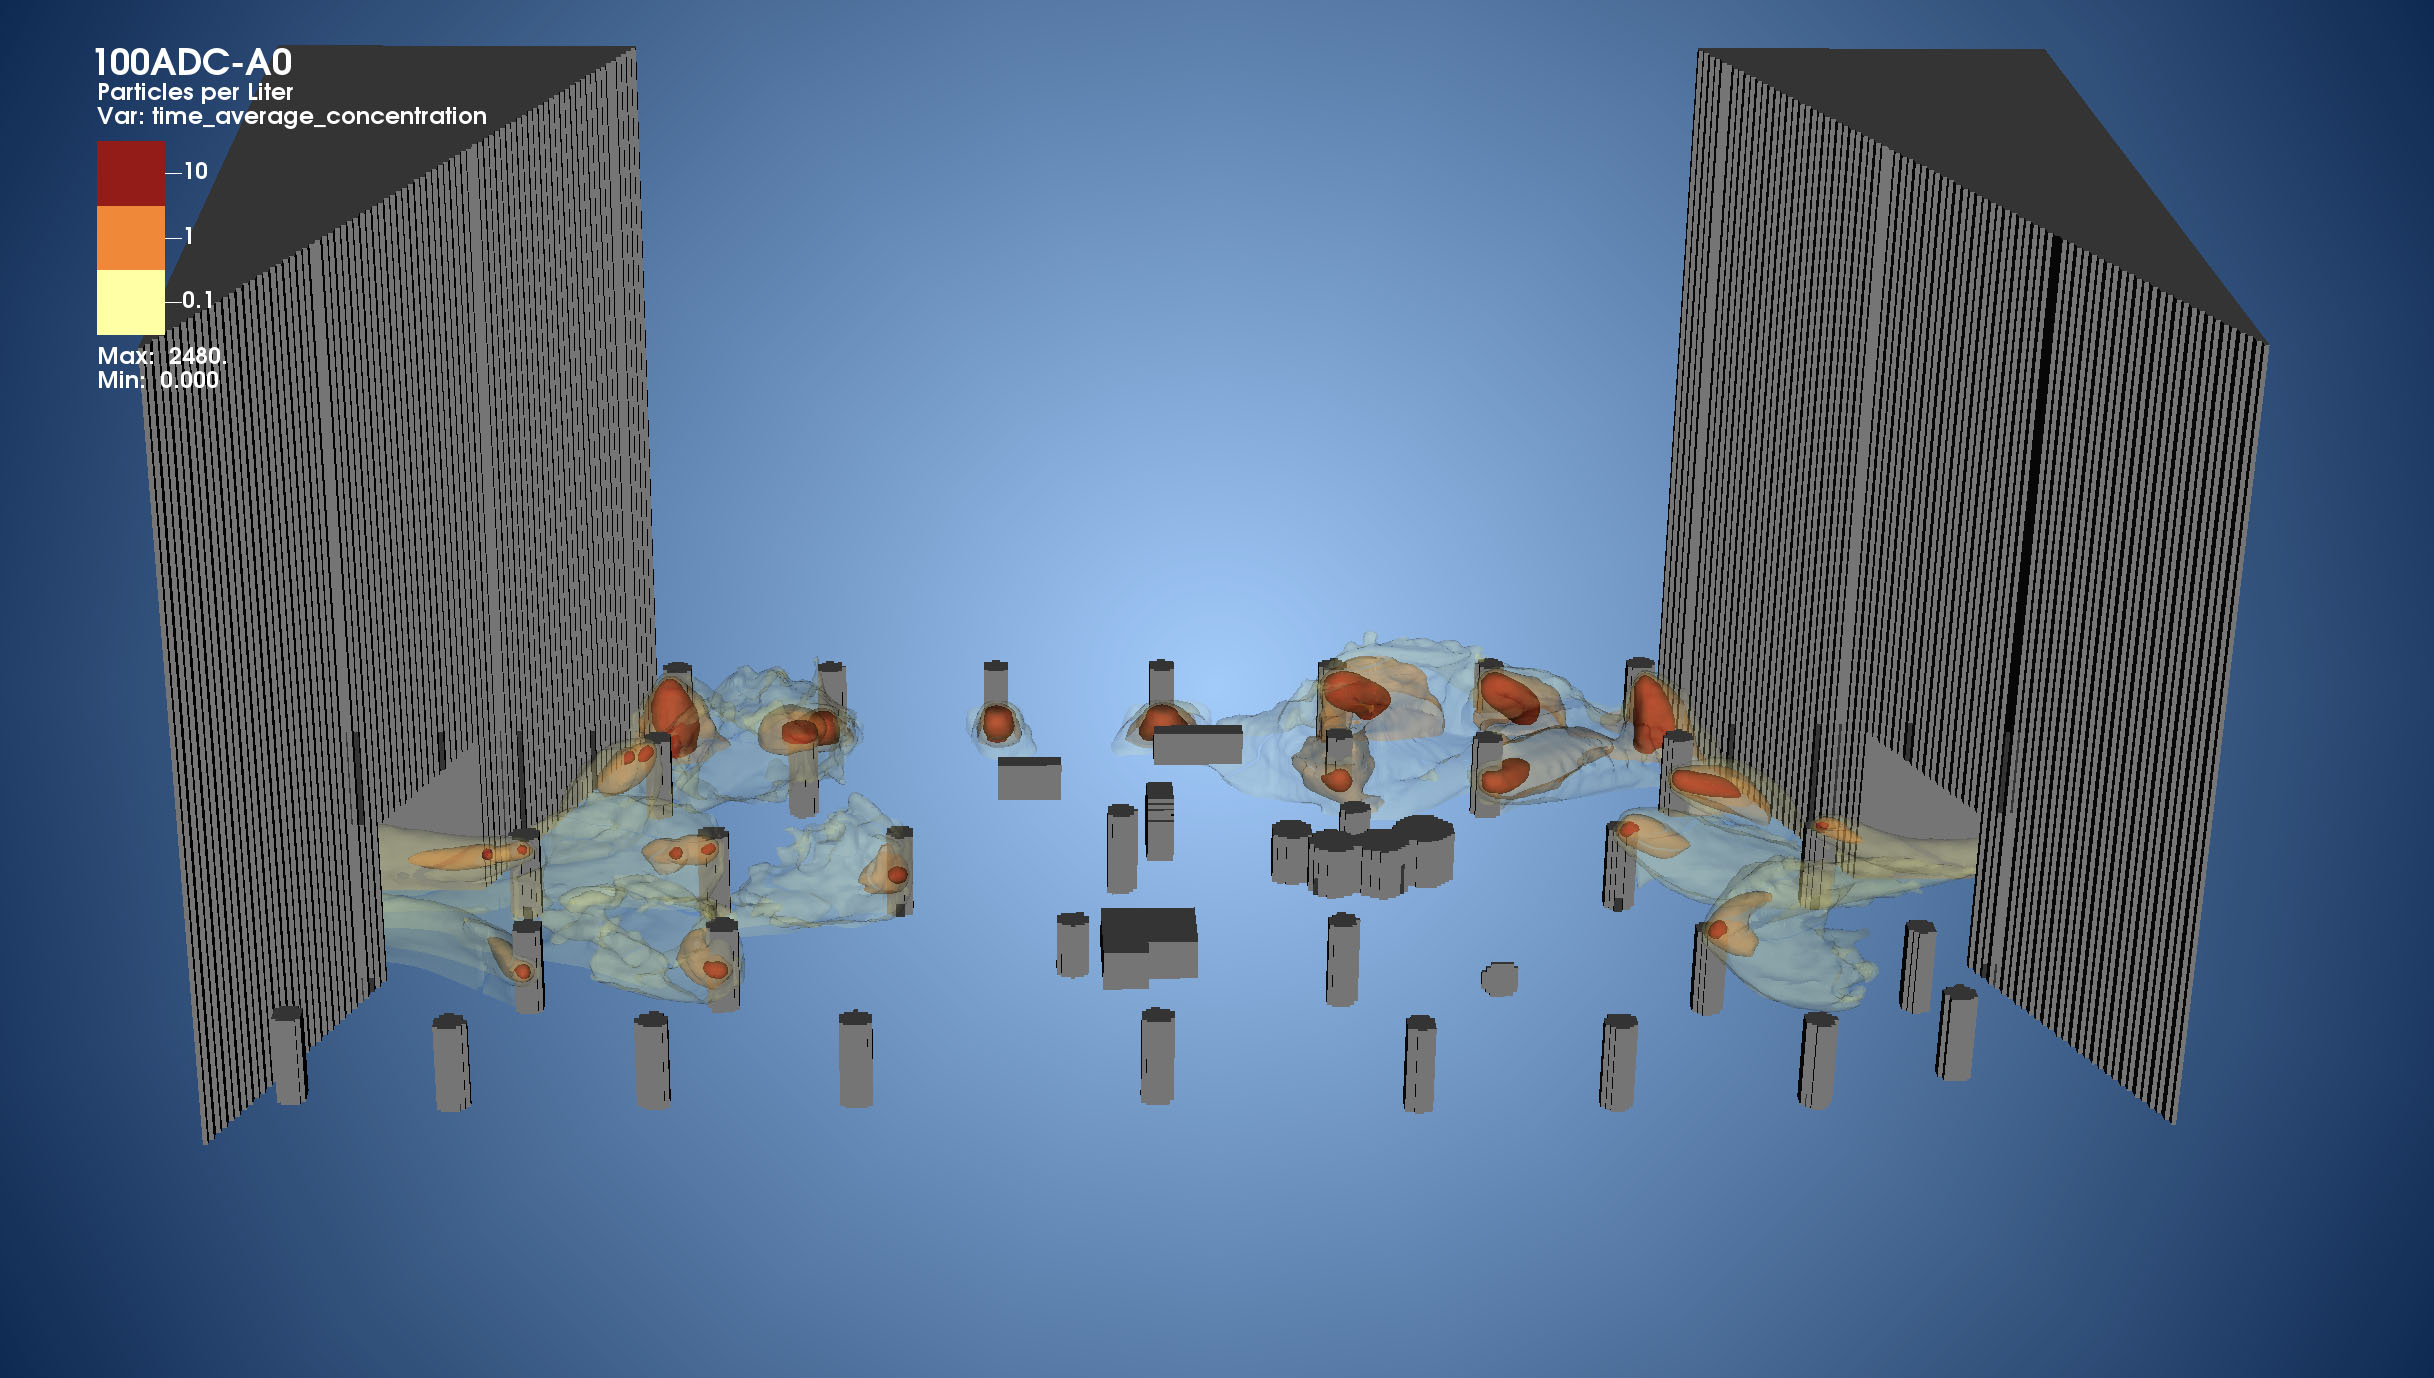
How HPC Helped the Utah Symphony Keep Its Doors Open During the Pandemic
By Tony Saad and James C. Sutherland
Department of Chemical Engineering, University of Utah
On June 23, 2020, we received an email from Professor Dave Pershing, former president of the University of Utah, asking if we could help the Utah Symphony/Utah Opera (USUO) to analyze the dispersion of airborne droplets emitted from wind instruments at Abravanel Hall (and later Capitol Theater). Thinking of this problem from an engineering perspective, and based on our knowledge of how viral transmis- sion works, a virus attaches itself to a respiratory droplet which is subsequently exhaled into the air. Although large droplets generally settle and lead to surface contamination, small “aerosolized” droplets become suspended in the air and move with it. This means that these aerosols can be modeled as a tracer in a fluid flow simulation. We were excited to help as this aligns closely with our expertise in Computational Fluid Dynamics (CFD).
Thanks to the generosity of CHPC in granting us over 600K CPU hours (~68 CPU years!), we were able to run over 25 simulations in total using our in-house code, Wasatch, a component of the Uintah Computational Framework. The first step in our analysis was to understand the baseline configuration of the airflow created by the HVAC in Abravanel Hall’s stage along with a proposed seating arrangement for the orchestra. We found significant accumulation of respiratory droplets in the stage area, indicating an increased risk of infection. To mitigate the accumulation of droplets in the baseline configuration, our team considered two “low-cost” mitigation strategies: (1) increasing the volume of air leaving the hall, and (2) rearranging the location of instruments so that super emitter and spreader instruments are located closer to return/exit vents. Combining these led to a decrease in particle concentrations by a factor of 100, a significant improvement over the baseline configuration.
For more information, see our Spring 2021 newsletter here.
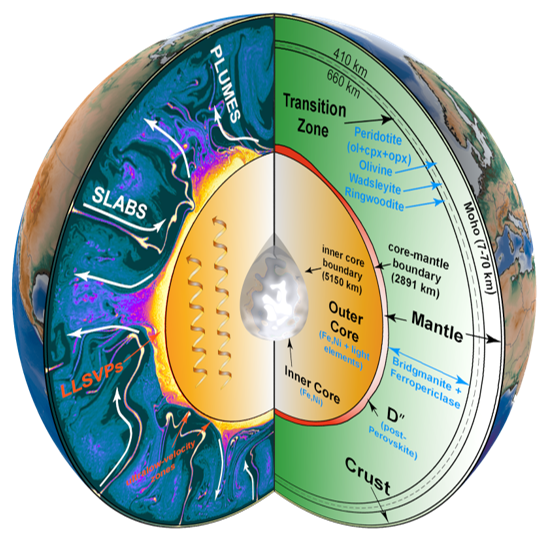
Mapping the Most Extremely Anomalous Features Within the Earth
By Michael Thorne
Department of Geology and Geophysics, University of Utah
At a depth of 2891 km the boundary between the Earth’s solid rocky mantle and liquid outer core, the core mantle boundary (CMB) provides the largest contrast in physical properties anywhere in the Earth (Earth layering and naming conventions are shown in the figure). There are anomalous features throughout each layer of the Earth. Yet, an even more enigmatic feature exists sitting atop the CMB, referred to as ultra low-velocity zones (ULVZs). No other feature within the Earth has properties as extreme as ULVZs. ULVZs appear to be relatively thin features (roughly 10 to 20 km thick) with a modest increase in density (~10%), but with exceptionally reduced seismic wave speeds. S-wave speed reductions have been modeled to be as large as 45% with respect to average mantle properties. Nothing else in the Earth has such dramatic variations in properties, yet we know almost nothing about these features. ULVZs were first discovered in 1993 [Garnero et al., 1993], and their existence has now been confirmed in over 50 seismic studies [see recent review by Yu and Garnero, 2018].
Despite this, as of a recent review conducted in 2018 less than 20% of the CMB had been probed for ULVZ existence. As a result, we barely know where they do and do not exist, which is key to deciphering what they may physically represent. As a result, we don’t have strong constraints on the ULVZ elastic parameters (P-, and S-wave velocity and density) which are necessary in order to determine their possible compositions. In this project, we are working to produce a global map of ULVZ locations and to determine their physical properties. In order to do this, we have created a new global catalog of ULVZ sensitive seismic waveforms by gathering data from available seismic repositories around the world. In our new data collection, we collected a total 606,770 seismograms from deep earthquakes (≥ 75 km) occurring between 1990 and 2017. We utilized machine learning approaches to assist us in narrowing down our data set to 271,602 high quality (low noise) seismic traces. For our first data analysis step, we used 58,155 seismograms in a narrow earthquake to seismometer distance range (epicentral distance). This range was chosen first as it displays the most characteristic waveforms that can be associated with ULVZs. But, because the answer is non-unique, we solved the problem several thousands of times using different starting random seeds to initiate the genetic algorithm. In this way, we can build a probabilistic map of ULVZ location.
For more information, see our Summer 2020 newsletter here.
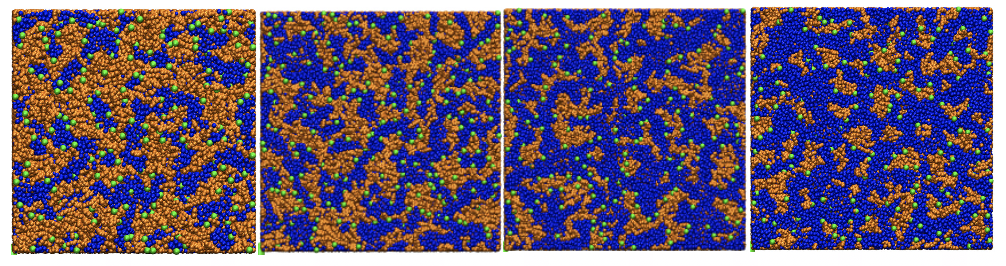
Polymer Simulations for Designing the Future of Fuel Cells
By Adam Barnett
Department of Chemistry, Molinero Research Group
The world’s power needs have more than doubled in the past 30 years, and are projected to increase more than 50% more in the next 30. This tremendous increase in energy needs, combined with the growing climate crisis created by the usage of fossil fuels to meet such demands, has driven the search for more efficient and renewable energy sources. One rapidly growing area of interest is fuel cells, which have been investigated since their inception in the early 1960’s and subsequent usage on the Apollo 11 mission to provide power to the command module as well as clean drinking water for astronauts.
Fuel cells are being investigated as one of many solutions to the growing energy needs of our planet due to their high efficiency, portability, and lack of greenhouse gas byproducts. By harnessing the direct flow of electrons during the chemical reaction between hydrogen and oxygen, fuel cells offer the maximum efficiency of converting chemical fuel to electrical power.
The rapid advance in computing capabilities over the past few decades has led to a greater interest in using simulations to understand and predict materials properties from their molecular structure and interactions, and using the results to guide materials design principles for a more rapid prototyping and development process. In the Molin- ero research group at the Department of Chemistry of the University of Utah, we use molecular simulations to study how the chemical structure of the polymers used for anion exchange membranes can be designed to solve their current limitations. A computationally efficient model that faithfully reproduces the physical properties of the membrane is paramount to connect these properties such as conductivity, electroosmotic drag, water uptake, chemical degradation, and mechanical stiffness to the molecular design and interactions of the polymer.
For more information, see our Summer 2021 newsletter here.
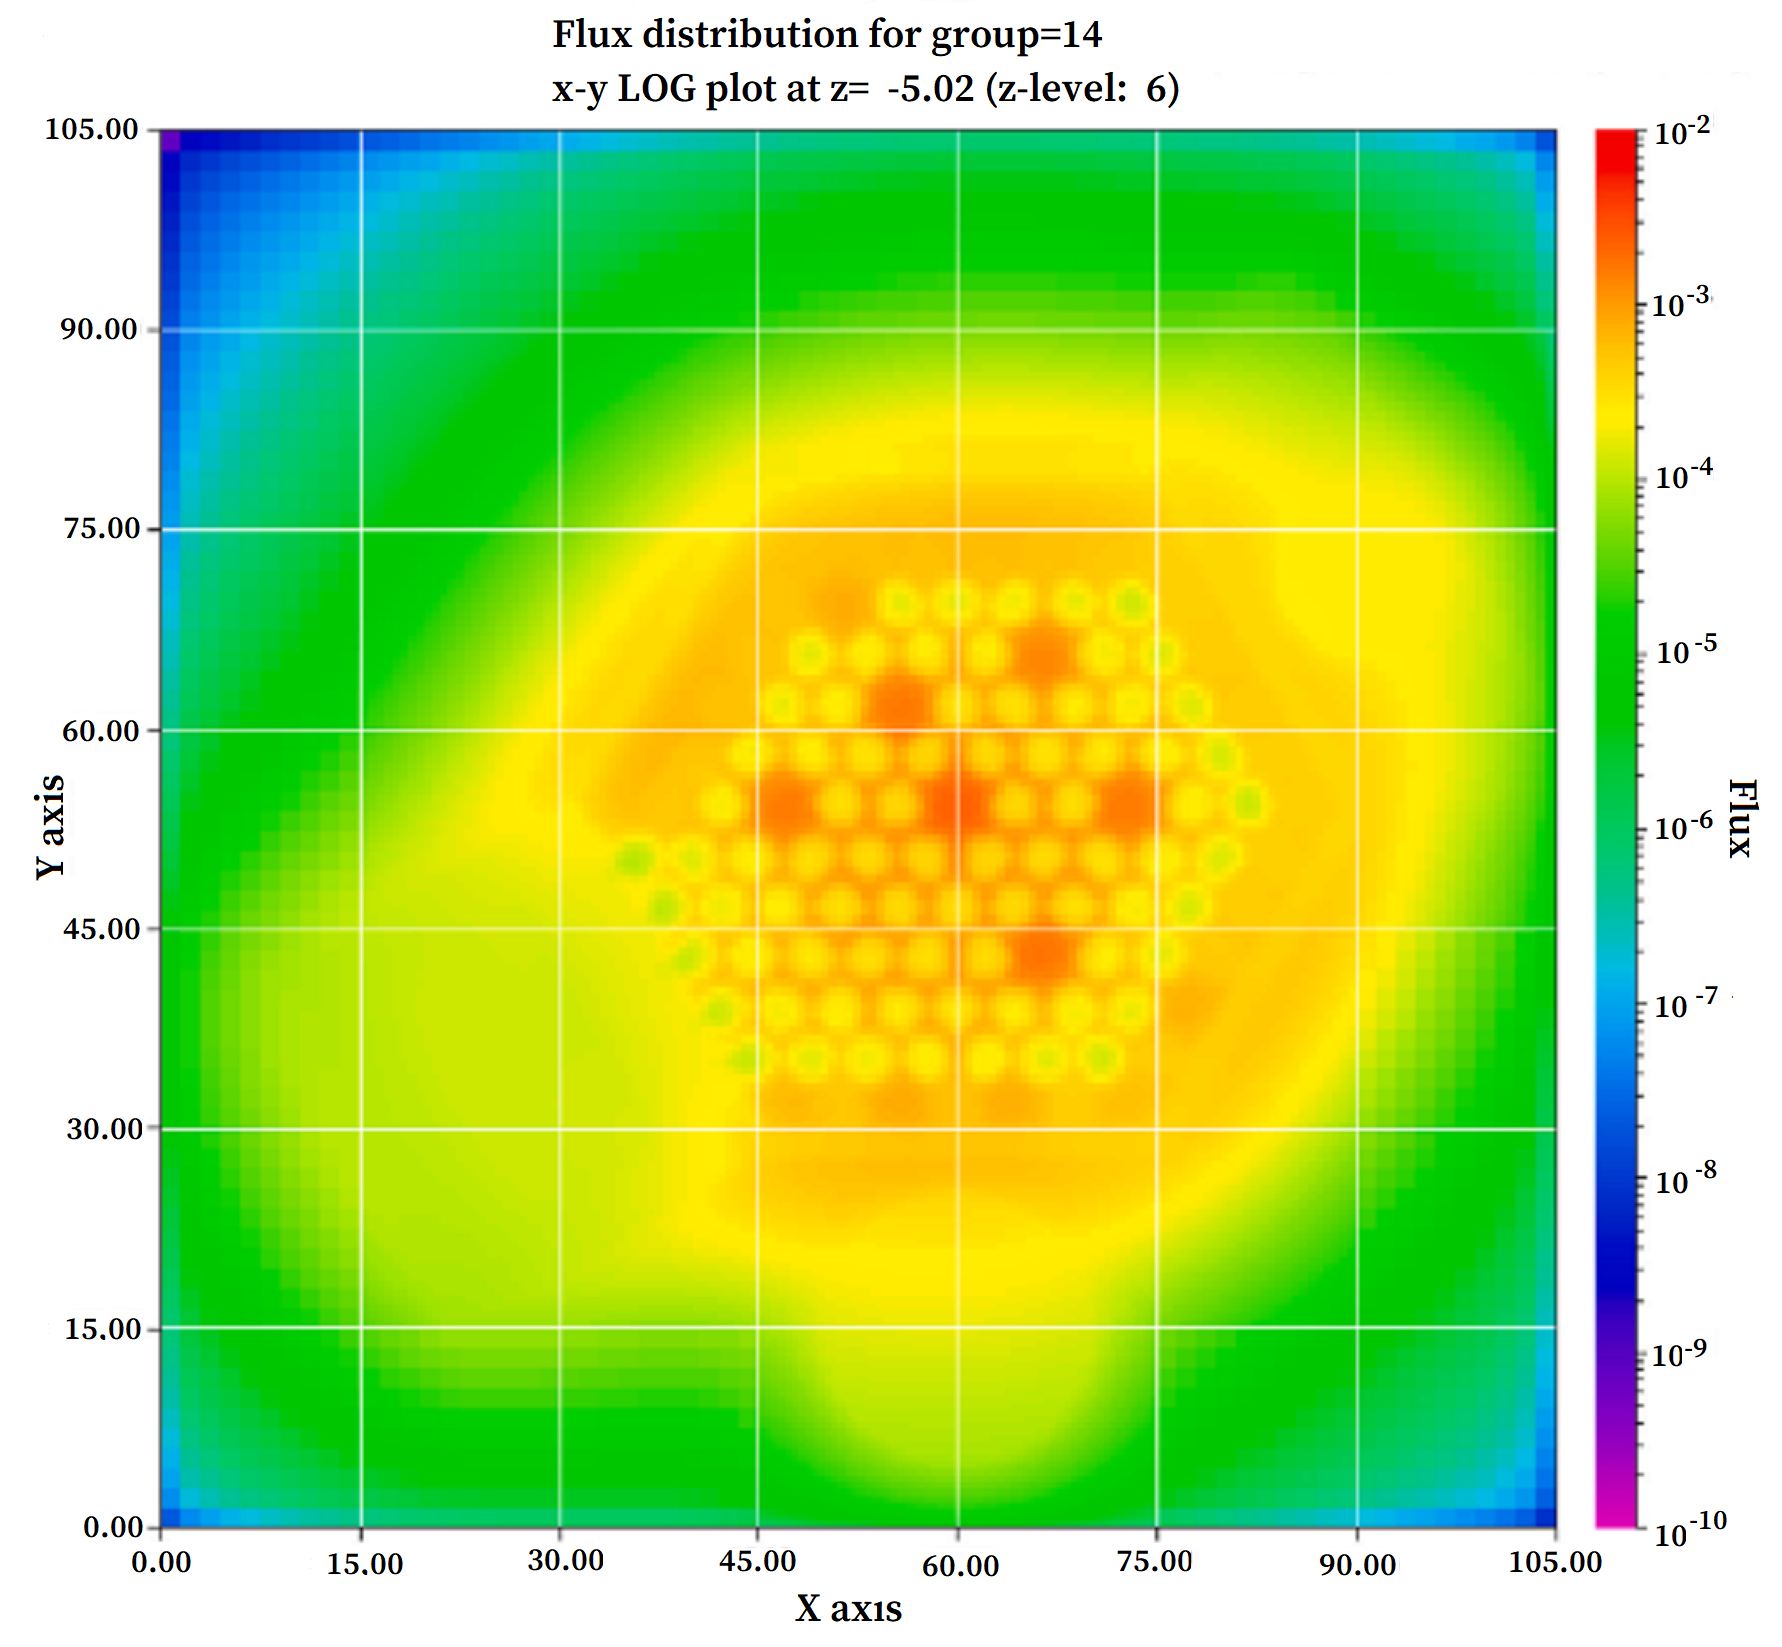
An Essential Need for HPC in Nuclear Engineering Applications
By Meng-Jen (Vince) Wang, and Glenn E. Sjoden
Department of Civil and Environmental Enginnering, University of Utah
The University of Utah’s Nuclear Engineering Program (UNEP) has greatly benefitted from the tremendous resources afforded for research by the University of Utah’s Center for High Performance Computing (CHPC). The modern reality is that nuclear applications cannot be practically fielded without an extraordinary amount of modeling and simulation carried out prior to actual testing, evaluation, or new engineering endeavor. For this reason, we must maintain access to “premier” computing resources, such as those available via CHPC, simply because models that require detailed radiation transport simulations are computationally intense. Overall, radiation transport simulations consist of two main approaches: deterministic solvers that require solutions of many billions of simultaneous equations, or Monte Carlo based solvers that require billions of particle histories to simulate, in addition to proper pre-processing of nuclear data to enable complex system computations. UNEP maintains HPC parallel optimized codes that can utilize both deterministic and Monte Carlo solution approaches; in fact, most often, we must apply both approaches to validate our findings to ensure all nuances of profiling “where the radiation goes” is fully explored. This is where having the resources enabled by CHPC is essential; these HPC frameworks are comprehensively pressed to execute extremely accurate models, enabling us to achieve what others may not be able to, allowing us to proceed with novel research objectives with the knowledge that we can successfully achieve our end goals.
For example, using both NOTCHPEAK and REDWOOD at CHPC, we have successfully executed simulations of highly accurate 3-D models of the University of Utah Training Reactor (UUTR), as shown in the above figure. Based on these results, we were able to complete the design of new neutron beam port and source configurations in our reactor, and complete a new beam stop and imaging chamber design. In addition, the simulations enabled us to design, optimize, and perform testing in our UUTR reactor to support a new methodology for Xe-135 gas standards for calibration studies used by the Comprehensive Test Ban Treaty Organization (CTBTO).
For more information, see our Spring 2022 newsletter here.
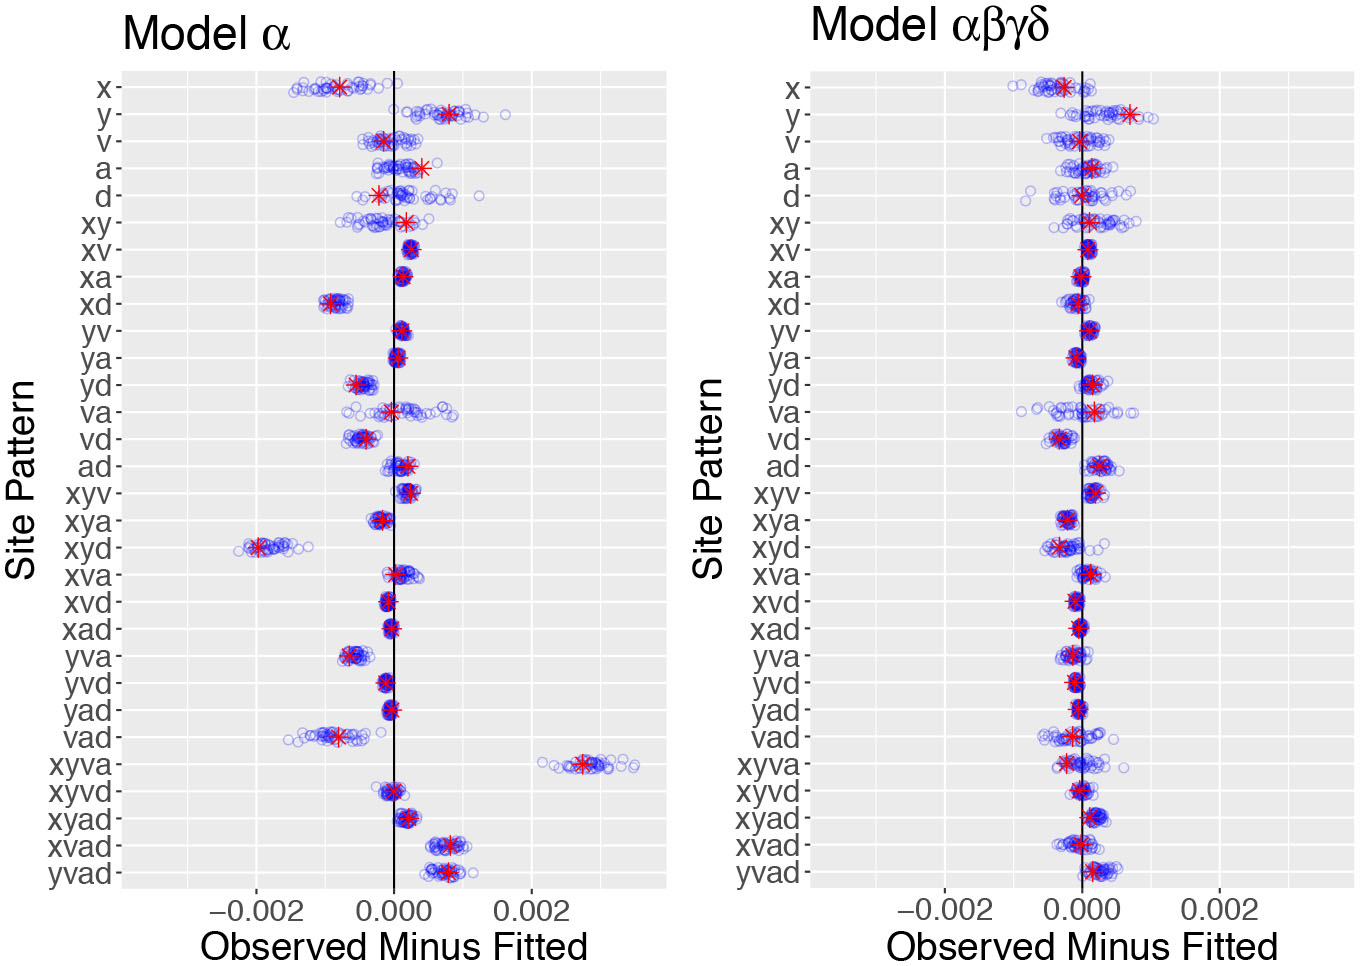
The Deep History of Human Populations
By Alan R. Rogers
Departments of Anthropology and Biology, University of Utah
Our lab has developed a new statistical method, called “Legofit,” which uses genetic data to estimate the history of population size, subdivision, and gene flow. Our recent publications have used it to study human evolution over the past 2 million years. Legofit studies the frequencies of “nucleotide site patterns,” which are illustrated in the figure. The solid black lines and arrows represent a network of populations. The dashed and colored lines show one of many possible gene genealogies that might occur at different nucleotide sites within the genome. Upper-case letters refer to populations. X represents an African population (the Yorubans), Y a European population, A Altai Neanderthals, and D Denisovans. S is an unsampled “superarchaic” population that is distantly related to other humans. Lowercase letters at the bottom of the figure label nucleotide site patterns. A nucleotide site exhibits pattern xya if random nucleotides sampled from X, Y, and A carry the derived allele, but those sampled from other populations are ancestral. Site pattern probabilities can be calculated from models of population history, and their frequencies can be estimated from data. Legofit estimates parameters by fitting models to these relative frequencies.
Nucleotide site patterns contain only a portion of the information available in genome sequence data. This portion, however, is of particular relevance to the study of deep population history. Site pattern frequencies are unaffected by recent population history because they ignore the within population component of variation. This reduces the number of parameters we must estimate and allows us to focus on the distant past. The archaeology of the early middle Pleistocene provided an additional clue. At this time, the “neandersovan” ancestors of Neanderthals and Denisovans separated from the ancestors of modern humans. Modern humans seem to have evolved in Africa, so it seemed plausible that neandersovans separated from an African population and emigrated to Eurasia. Had they done so, they would have encountered the previous “superarchaic” inhabitants of Eurasia, who had been there since about 1.85 million years ago. This suggested a fourth episode of admixture, labeled δ in the figure, from superarchaics into neandersovans.
For more information, see our Spring 2020 newsletter here.
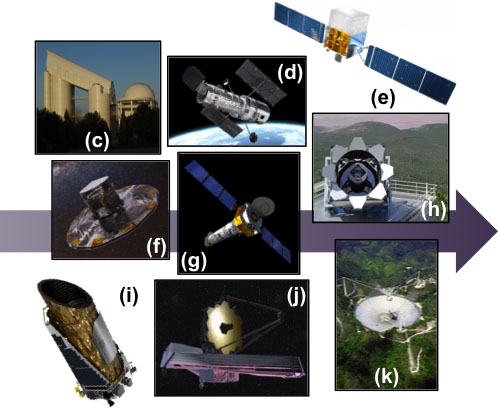
From Planets to Black Holes: Tracing the History of the Universe
By Gail Zasowski and Joel Brownstein
Department of Physics and Astronomy, University of Utah
Humans have carefully observed and tracked objects in the night sky since before recorded history. In the absence of light pollution, there are about 10,000 stars visible to the naked human eye, only about 5,000 at one time, of course, the Earth being famously opaque to optical light. When the telescope was developed in the early 1600s, we learned that there were far more things in the sky than our simple eyes can see; as instruments were developed that could detect light in other parts of the electromagnetic spectrum, we realized that there were objects and energy patterns in the sky that we could never see with our eyes, no matter how sensitive. And the Universe is not static, binary stars whip around each other, black holes flare brightly as they gobble up gas, and galaxies merge in billion-year-long collisions. How do we observe and analyze all these patterns to understand the nature of the Universe?
Enter astronomical surveys, and in particular, the newly-launched fifth generation of the Sloan Digital Sky Survey (SDSS). The first four generations of SDSS were each, in their own way, ground-breaking in terms of scientific goals and methods, and the new SDSS-V continues that tradition. As the data storage and processing hub of the survey, the University of Utah plays a very important role in the discoveries that will arise from SDSS-V’s massive data trove throughout the 2020s. SDSS-V is a spectroscopic survey, which means it collects high-resolution spectra of objects rather than taking images (see figure). With spectra, astronomers can infer (among other properties) the line-of-sight velocity, temperature, and composition of a star; the redshift, average age and stellar motions of a chunk of galaxy; the density and composition of intergalactic gas clouds; and the density and temperature of expanding supernova remnants. In many cases, the changes in these properties over time is even more exciting -- e.g., the change in density and temperature of a supernova remnant (which happens over scales of hours and days) tells us how the explosion material and energy is being deposited back into the interstellar gas and dust. Another key part of SDSS-V looks closer to home, collect- ing data for more than 5 million stars in our own Milky Way Galaxy and in a handful of our smaller galactic neighbors. These spectra are analyzed to get the stars’ temperatures, compositions, surface gravities, and line-of-sight velocities, which can be used to infer distances, ages, and orbit within the galaxy. By mapping these properties across the Milky Way, for example, ages and chemical compositions, we will learn an enormous amount about when, where, and how the Milky Way formed its stars.
For more information, see our Fall 2020 newsletter, here.
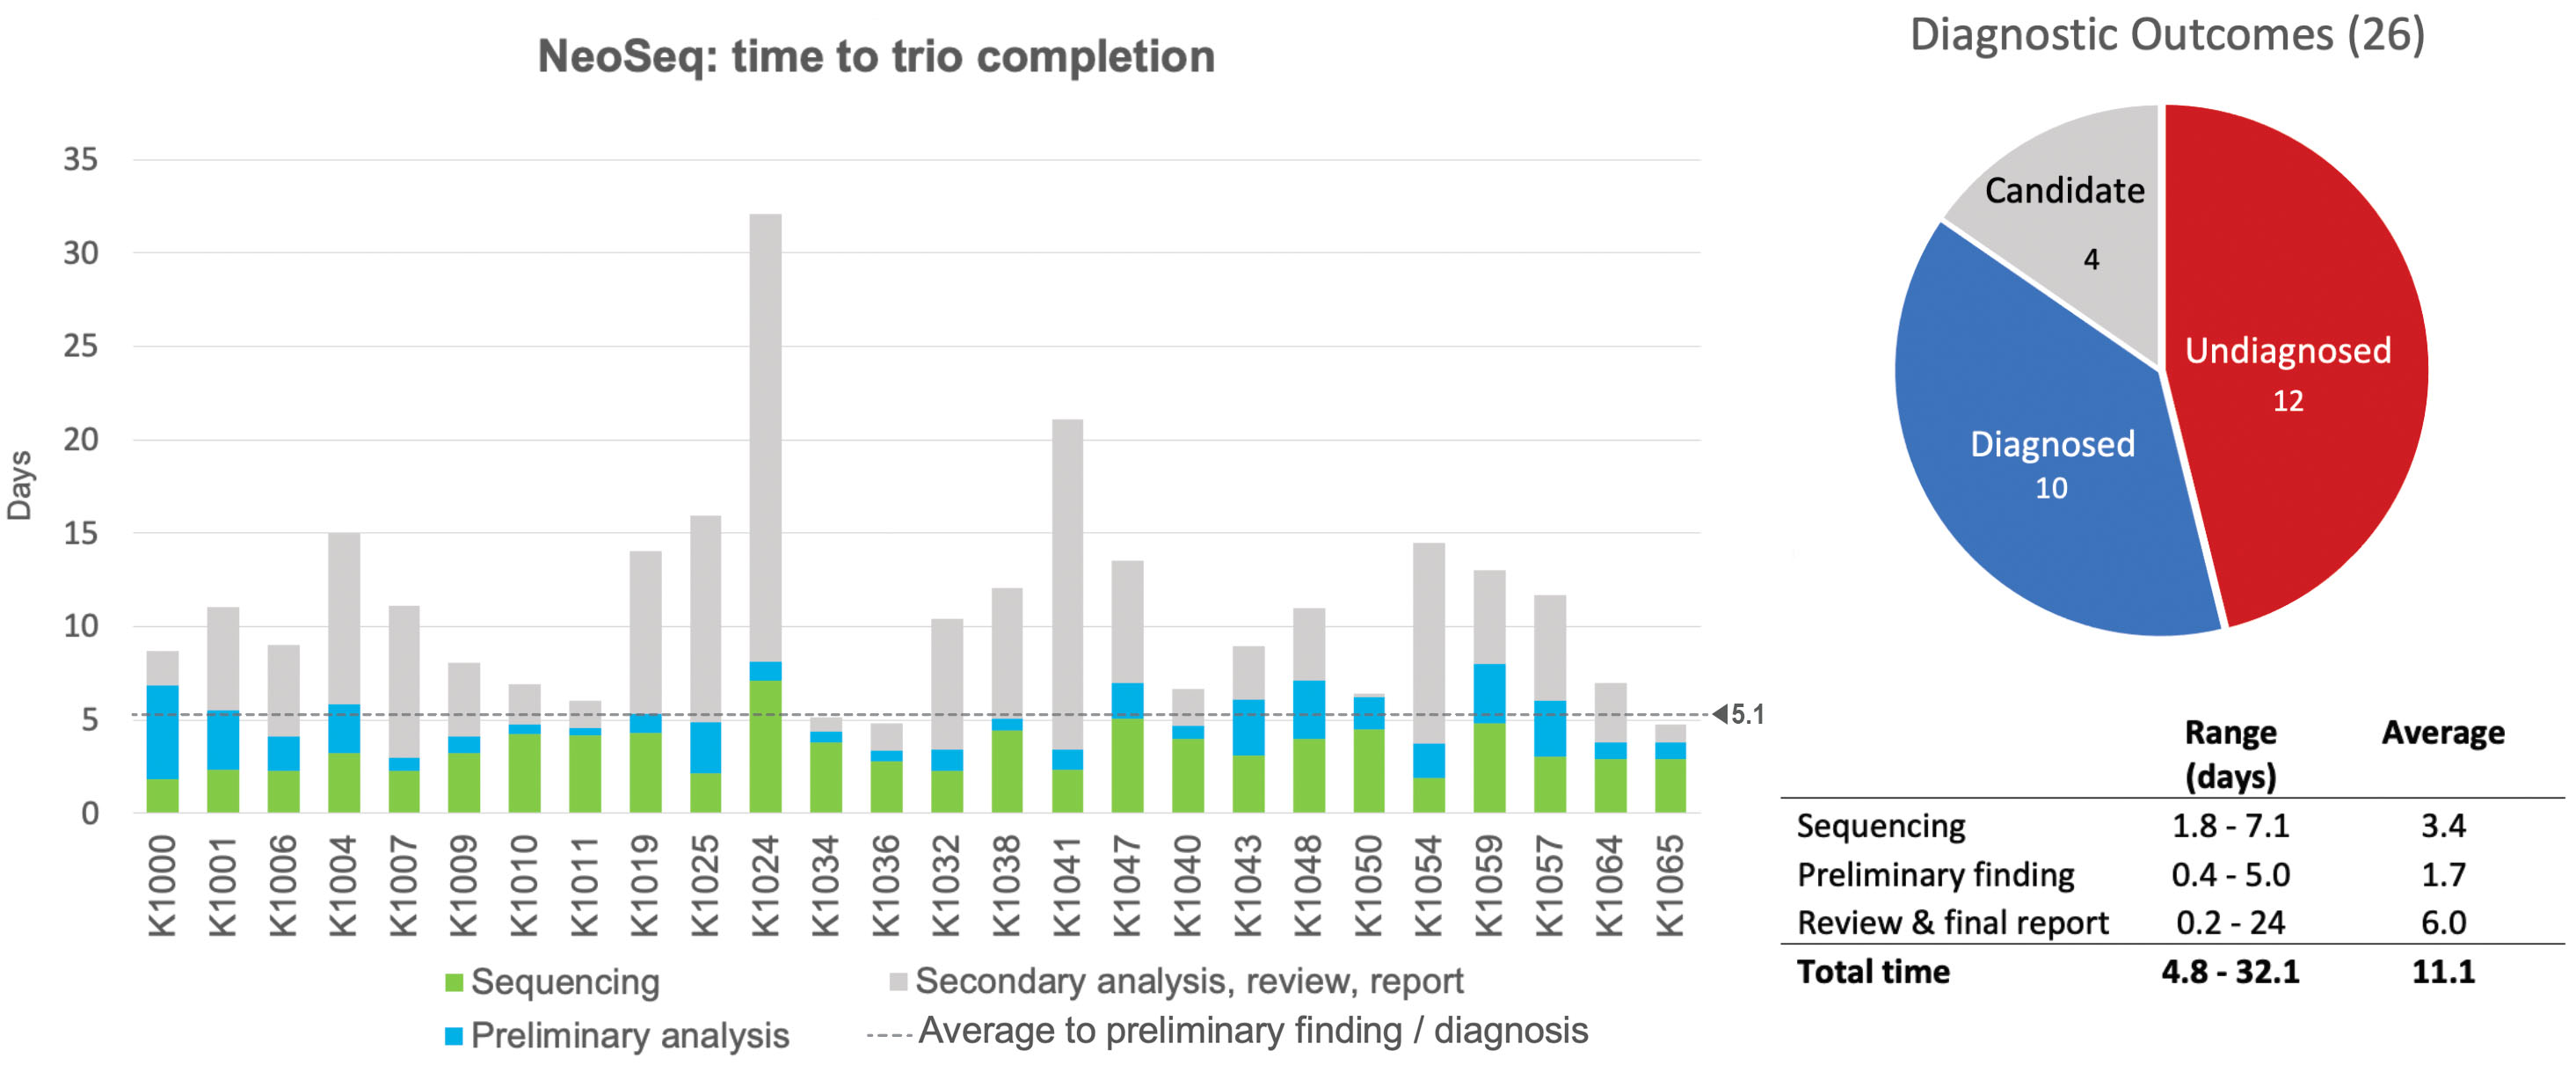
NeoSeq: Faster Diagnosis-Better Care
By Utah Center for Genetic Discovery and University of Utah Health
Whole genome sequencing has facilitated a far greater understanding of the biology of many organisms as well as revealed significant genetic contributions to human disease. However, leveraging sequencing based approaches for use in clinical diagnostics faces a number of logistical as well as regulatory hurdles. The University of Utah is uniquely positioned to explore the use of genome sequencing as a diagnostic tool given its extensive experience in both healthcare and research. NeoSeq is a pilot project to quickly and accurately detect genetic disorders among newborns at the University of Utah Hospital neonatal intensive care unit (NICU). The purpose of the NeoSeq is to develop a rapid whole genome sequencing protocol to provide a genetic diagnosis for critically ill infants in the University of Utah Hospital NICU. Patients and their parents are sequenced on a research basis to identify genes that may contribute to a given disease or condition. Sequencing derived findings are further validated through clinically approved tests and shared with medical staff and caregivers to improve patient outcomes. Early and accurate diagnosis can improve outcomes, save lives, and lower treatment costs by allowing for targeted clinical interventions, abandonment of treatments likely to be ineffective, and proper referral of patients to specialists or palliative care. Additional applications include genetic counseling and future family planning. A diagnosis can also bring peace of mind to parents even when no treatment is possible. With this project, University of Utah Health joins a very small group of hospitals worldwide that are able to offer this type of care.
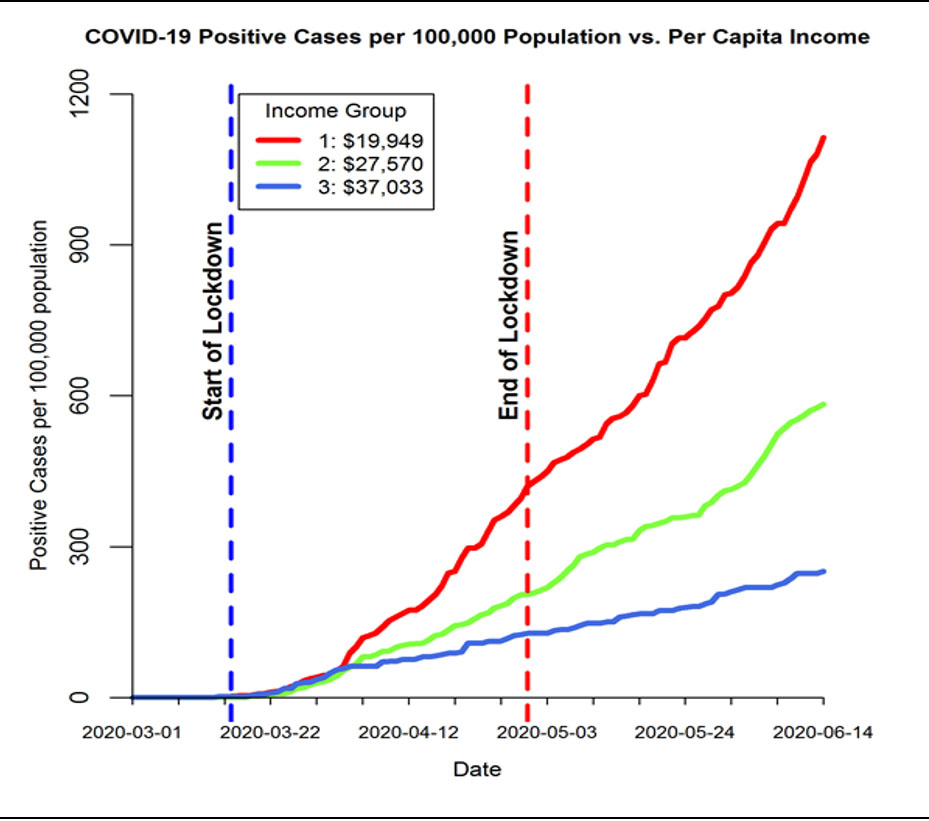
COVID-19 Incidence Rates in Urban Areas: Role of Structural Inequality at the Neighborhood Scale
By Daniel L. Mendoza, Tabitha M. Benney, Rajive Ganguli, Rambabu Pothina, Cheryl S. Pirozzi, Cameron Quackenbush, Eric T. Crosman, Yue Zhang
Departments of City and Metropolitan Planning, Atmospheric Sciences, Internal Medicine: Pulmonary and Critical Care, Political Science, Mining/Engineering, Life, Earth, and Environmental Sciences, Internal Medicine: Epidemiology, University of Utah, West Texas A&M University
Local and federal social distancing policies implemented in the Spring of 2020 in response to the growing COVID-19 pandemic, as well as subsequent lockdown policies thereafter, have undoubtedly saved many human lives. Despite this, emerging research suggests that such policies have not resulted in equal outcomes for minority populations, specifically for low income and minority populations. Research efforts in this area have been unable to fully explain the mechanisms that produce these outcomes.
We used a novel approach that enables us to focus on the micro-processes of “structural inequality” at the neighborhood (zip code) level to study the impact of stay-at-home policies on COVID-19 positive case rates in urban setting (Salt Lake County or SLC) over three periods. Our research explores three propositions about the relationship between lockdown policies, structural factors of inequality, and COVID-19 positive case rates for the study periods:
- Do social distancing policies keep people at home (or impact mobility)?
- Do stay-at-home orders benefit all populations equally?
- Do all groups have similar COVID-19 incidence rates?
Our research suggests that structural factors of inequality interact with public health, policy, and disease transmission. The reduction in traffic suggests differing response to lockdown policies which is likely a factor influencing different COVID-19 incidence rates. The rebound of traffic after easing of lockdown policies is comparatively swift for affluent groups. Unlike affluent communities, low income, high minority status communities showed smaller rebound on post-lockdown recovery.
Future policies should include remedies to deal with inequalities found in our research so that most vulnerable populations can be benefitted. As vaccination efforts continue, vulnerable and affected populations should be considered for equitable distribution.
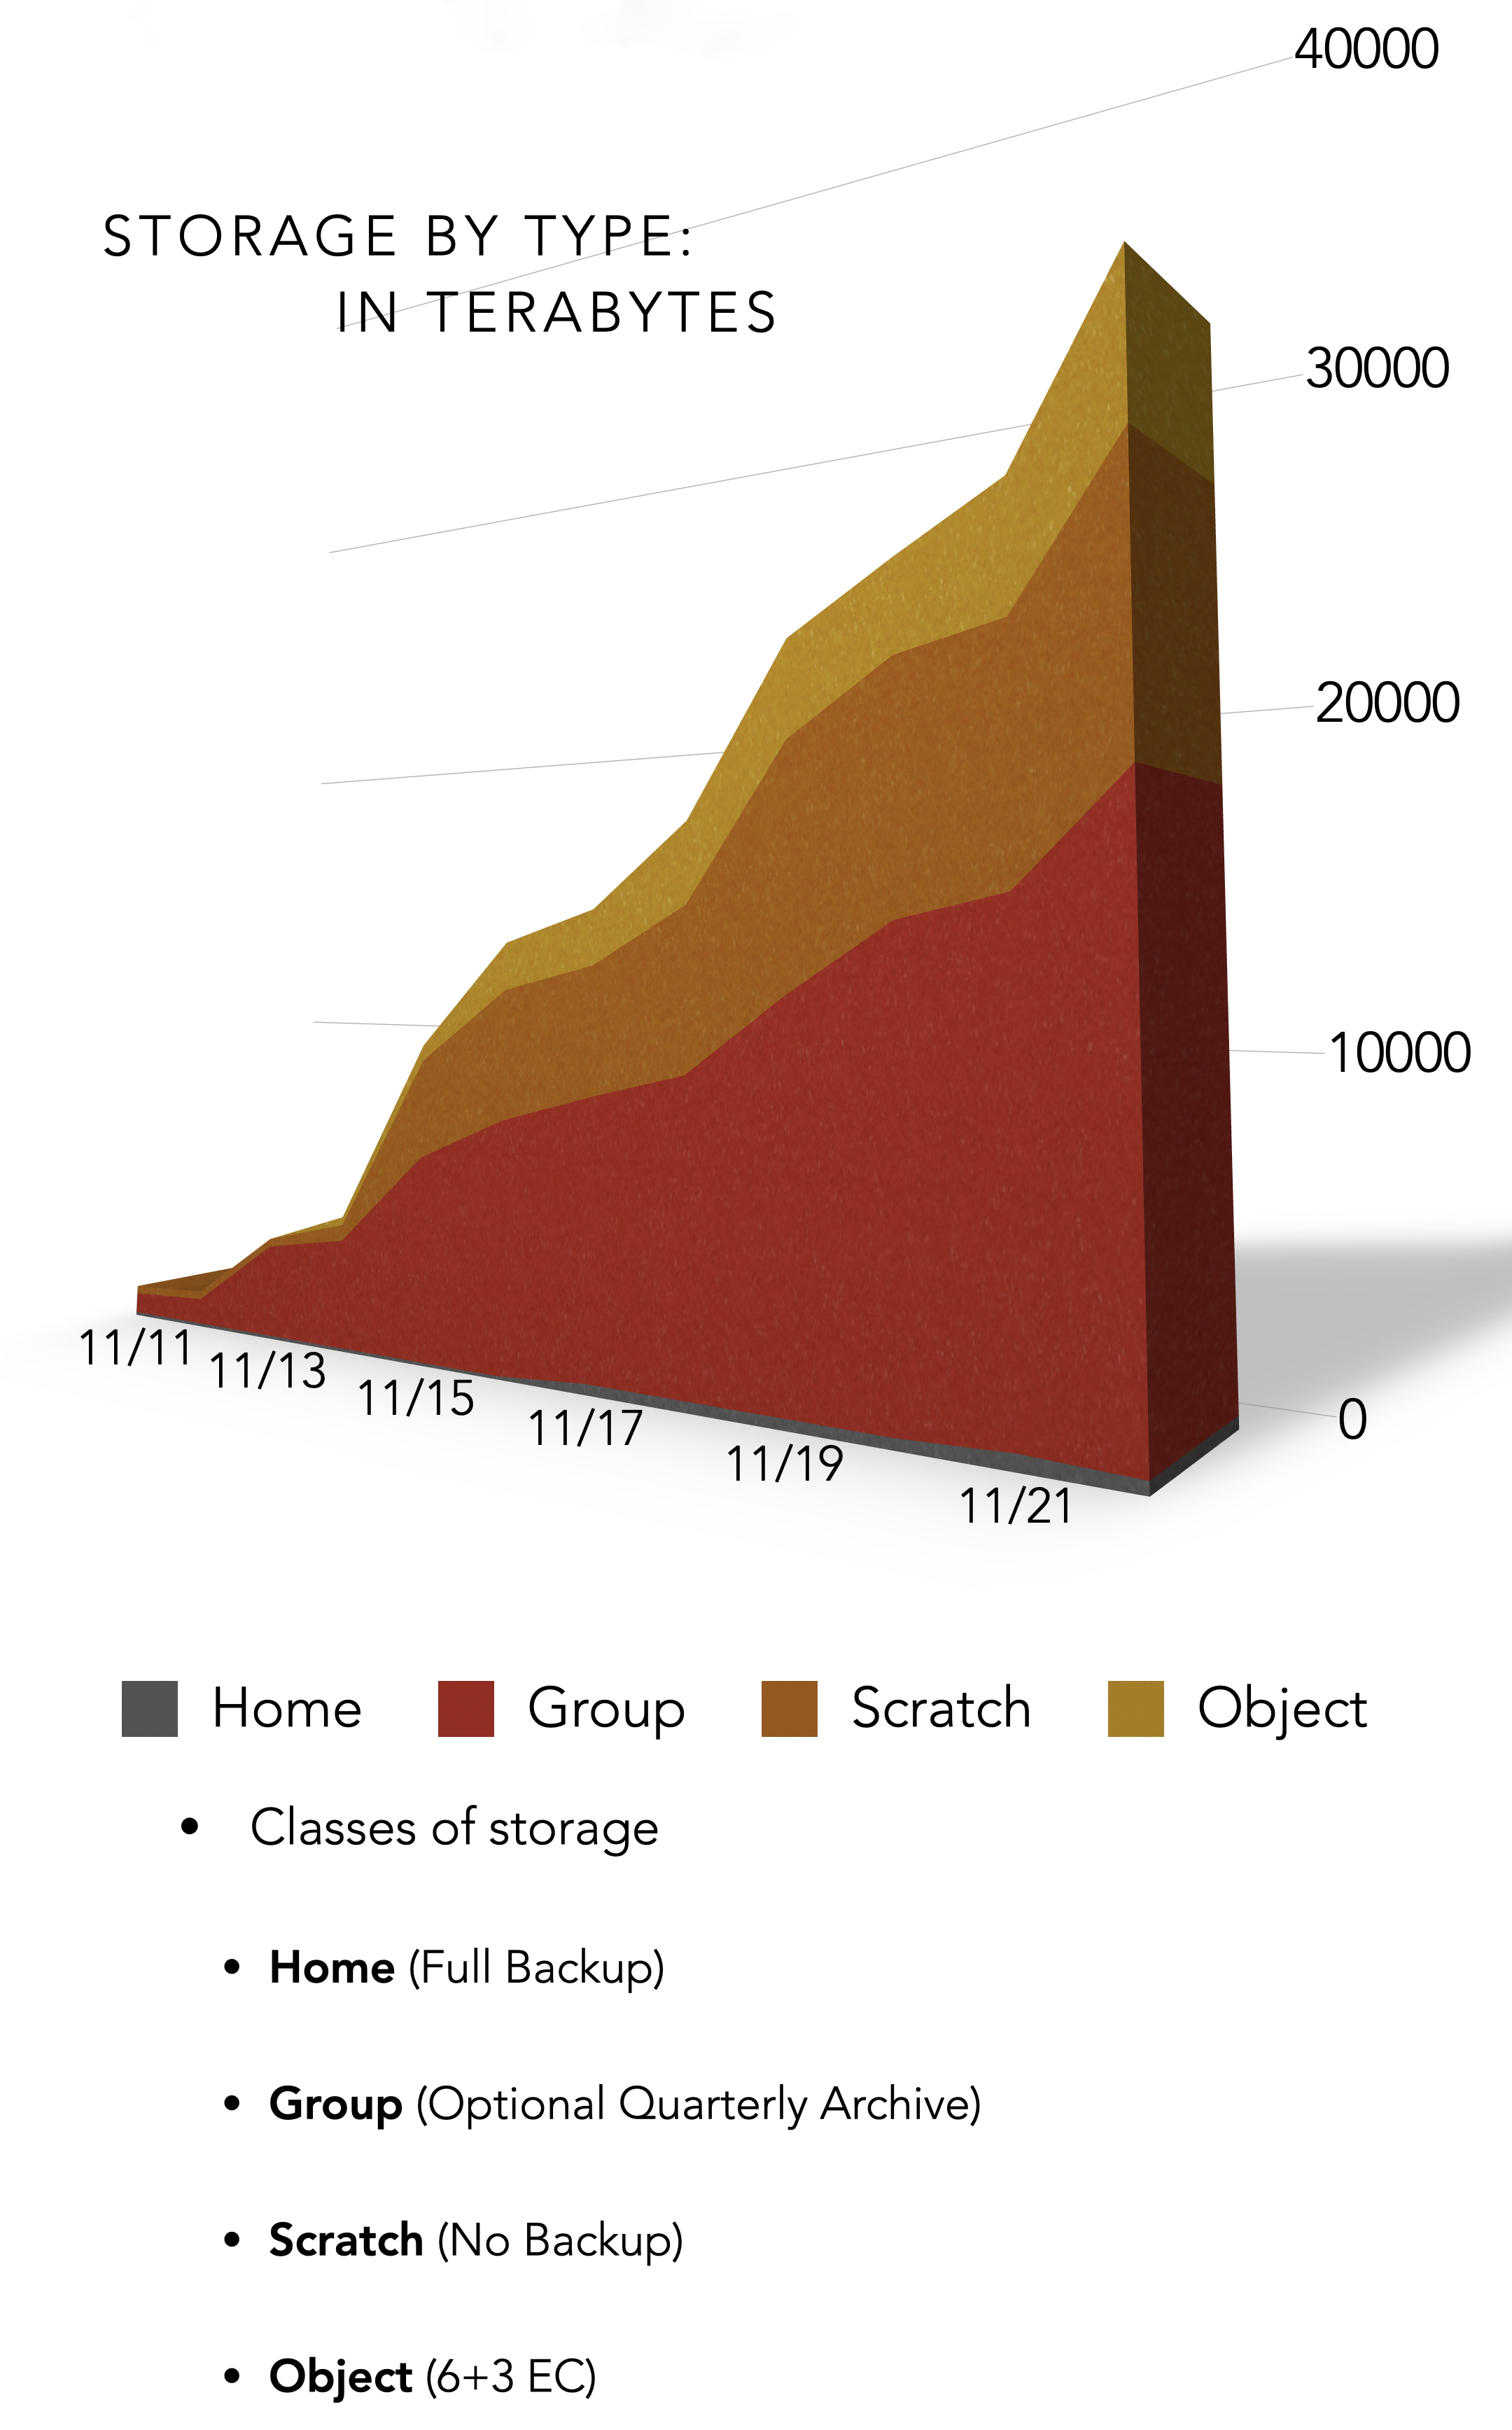
CHPC Metrics: Storage Type: Terabytes
By CHPC Staff
The above graph shows the growth in storage, given by type (home, group, scratch, & object). Currently, CHPC supports a total of over 30 terabytes of storage.
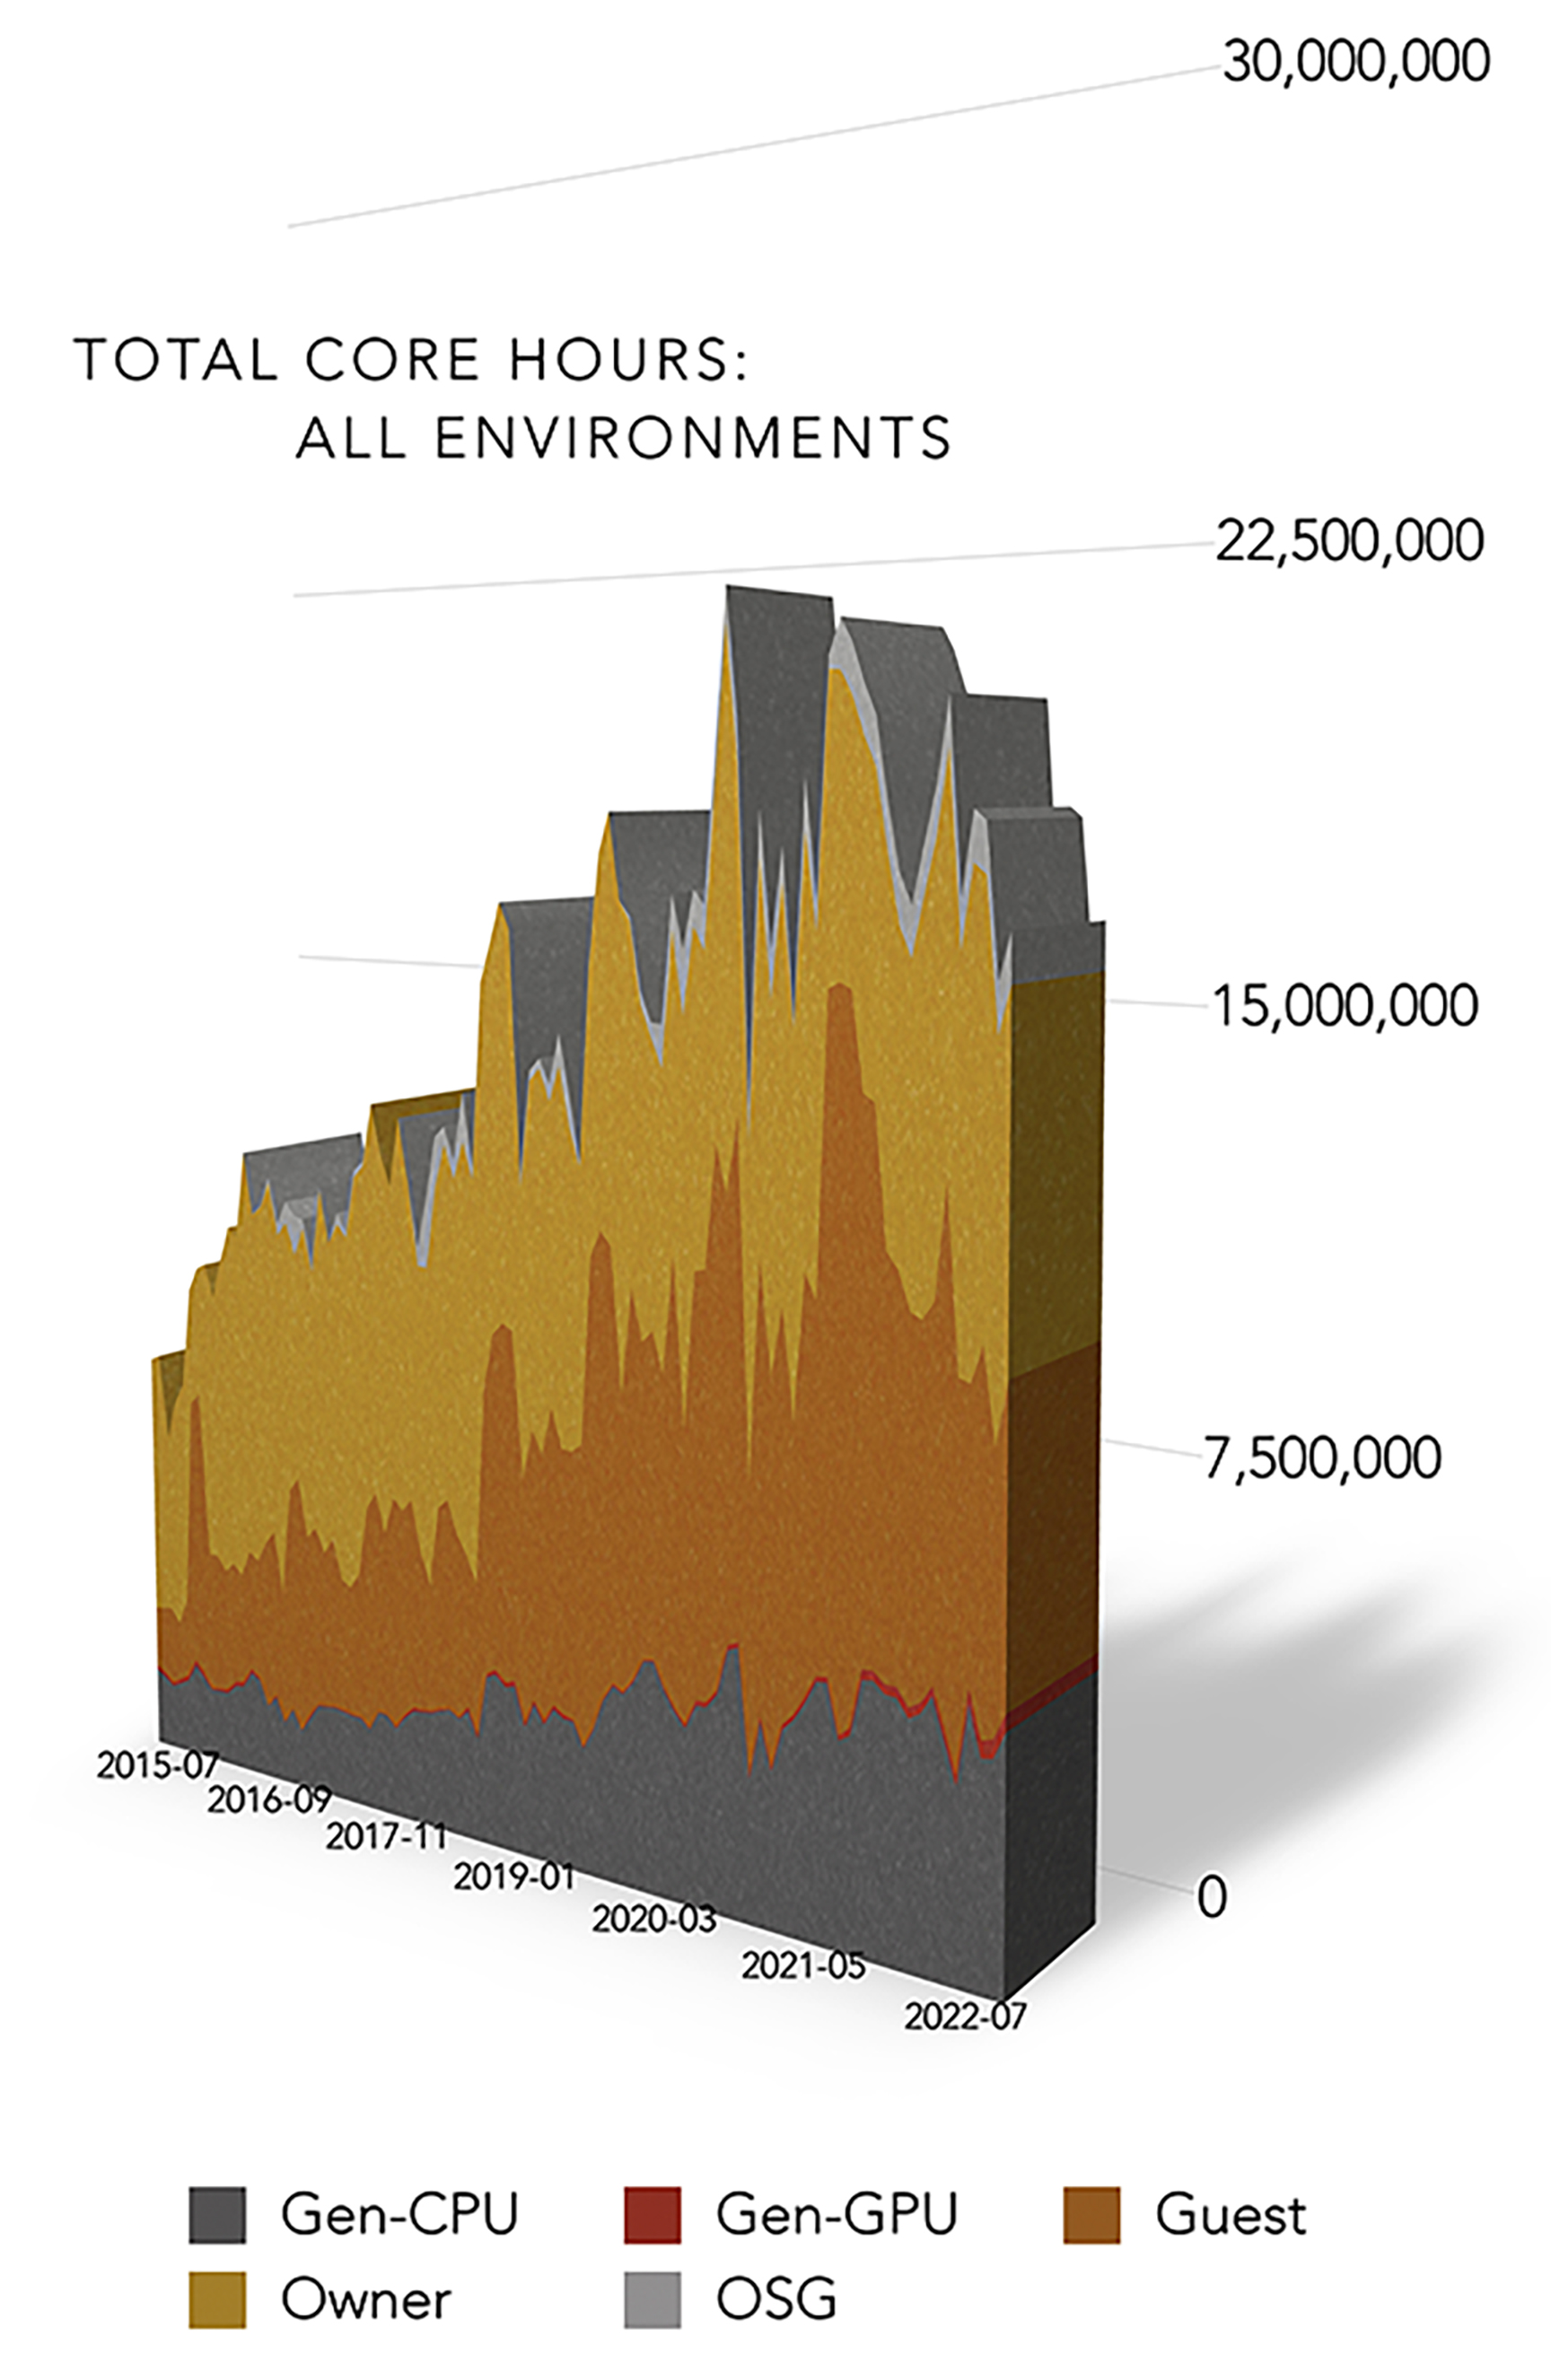
CHPC Metrics: Total Core Hours: All environments
By CHPC Staff
The above graph shows the growth in the core hours used per month on all CHPC compute clusters, grouped by general CPU and GPU resources, owner use of owner resources, guest usage on owner resources, and usage by the open science grid (OSG).
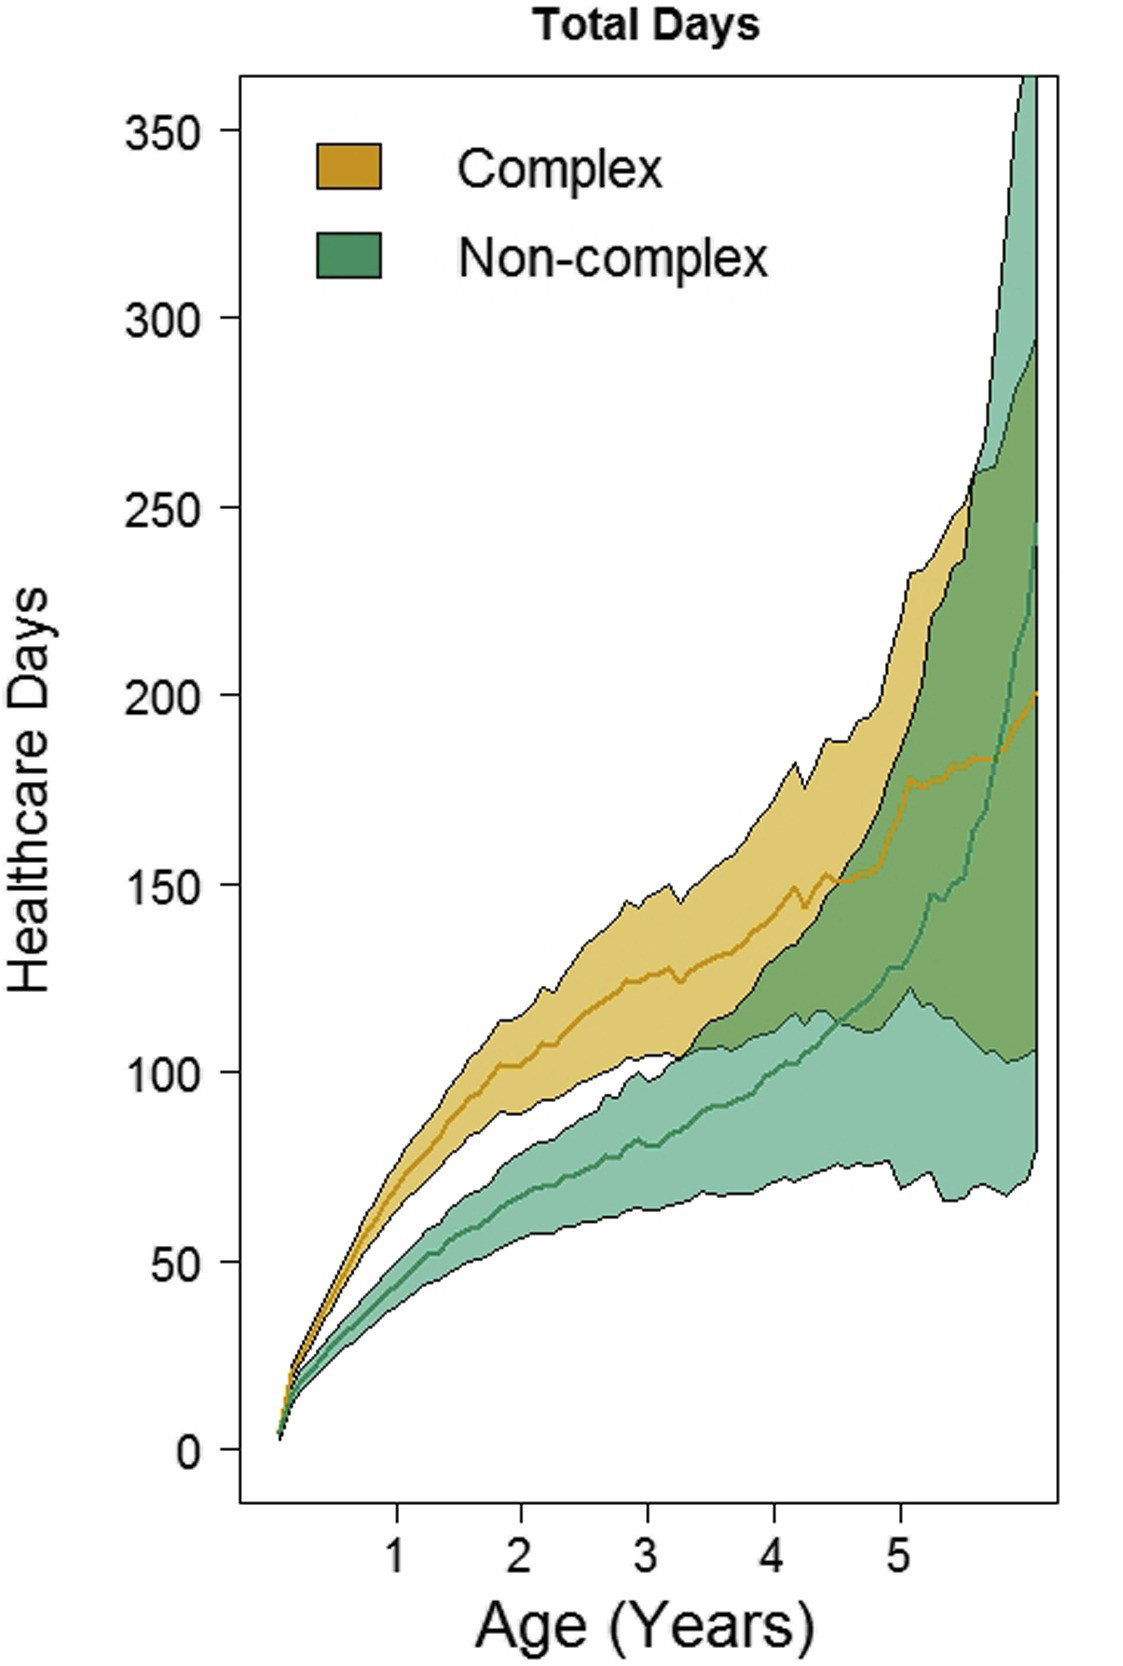
Improving the Quality of Healthcare by Using Big Data Analytics
By Joshua J Horns, Rupam Das, Niraj Paudel, Nathan Driggs, Rebecca Lefevre, Jim Hotaling, Benjamin Brooke
Department of Surgery, University of Utah Health
Over the last decade, healthcare research has increasingly used big-data to understand patterns of disease, efficacy of treatments, healthcare inequities, and much more. The Surgical Population Analysis Research Core (SPARC) is a team of data scientists, statisticians, and surgeon-scientists dedicated to improving the quality of healthcare through population-health research using big-data analytics. SPARC was founded in 2018 at the University of Utah and since that time has produced over 200 papers and abstracts and received $13,000,000 in grant funding. The Center for High Performance Computing (CHPC) at the University of Utah has allowed SPARC to conduct exciting, novel research with important and immediate implications to patient care.
Anorectal malformations (ARM) are rare congenital anomalies that result in life-long functional impairment. ARMs are uncommon, only occurring 2-5 times in every 10,000 births, which can make it a difficult patient population to study. Surgical interventions to address ARMs, as well as on-going care afterward, can result in a significant financial burden to patients and their families and many days spent in care.In 2022, SPARC worked on a project led by Dr. Michael Rollins of Primary Children’s Hospital attempting to quantify the number of days children with ARMs spend in the hospital and how much cost the families incur. Thanks to the computational resources at CHPC, we were able to search through over 7 trillion diagnoses from across the United States to identify 664 children born with an ARM. We followed these patients for the first five years of life and noted every hospitalization and clinic visit they made during that time as well as their associated costs.
Because of this work, we were able to estimate that children born with an ARM will, on average, spend nearly 20% of their first year of life in the hospital and ultimately make 158 healthcare visits by age five. Financially, these encounters totaled $273,000 representing an enormous economic strain on families. Because of this work, we were able to estimate that children born with an ARM will, on average, spend nearly 20% of their first year of life in the hospital and ultimately make 158 healthcare visits by age five.
As SPARC continues its mission to improve healthcare by producing high-quality, novel research, we rely heavily on the data management and computer science expertise offered by CHPC. SPARC is always open to external collaboration. For more information and to get in touch, please see https://medicine.utah.edu/surgery/research/cores/sparc.
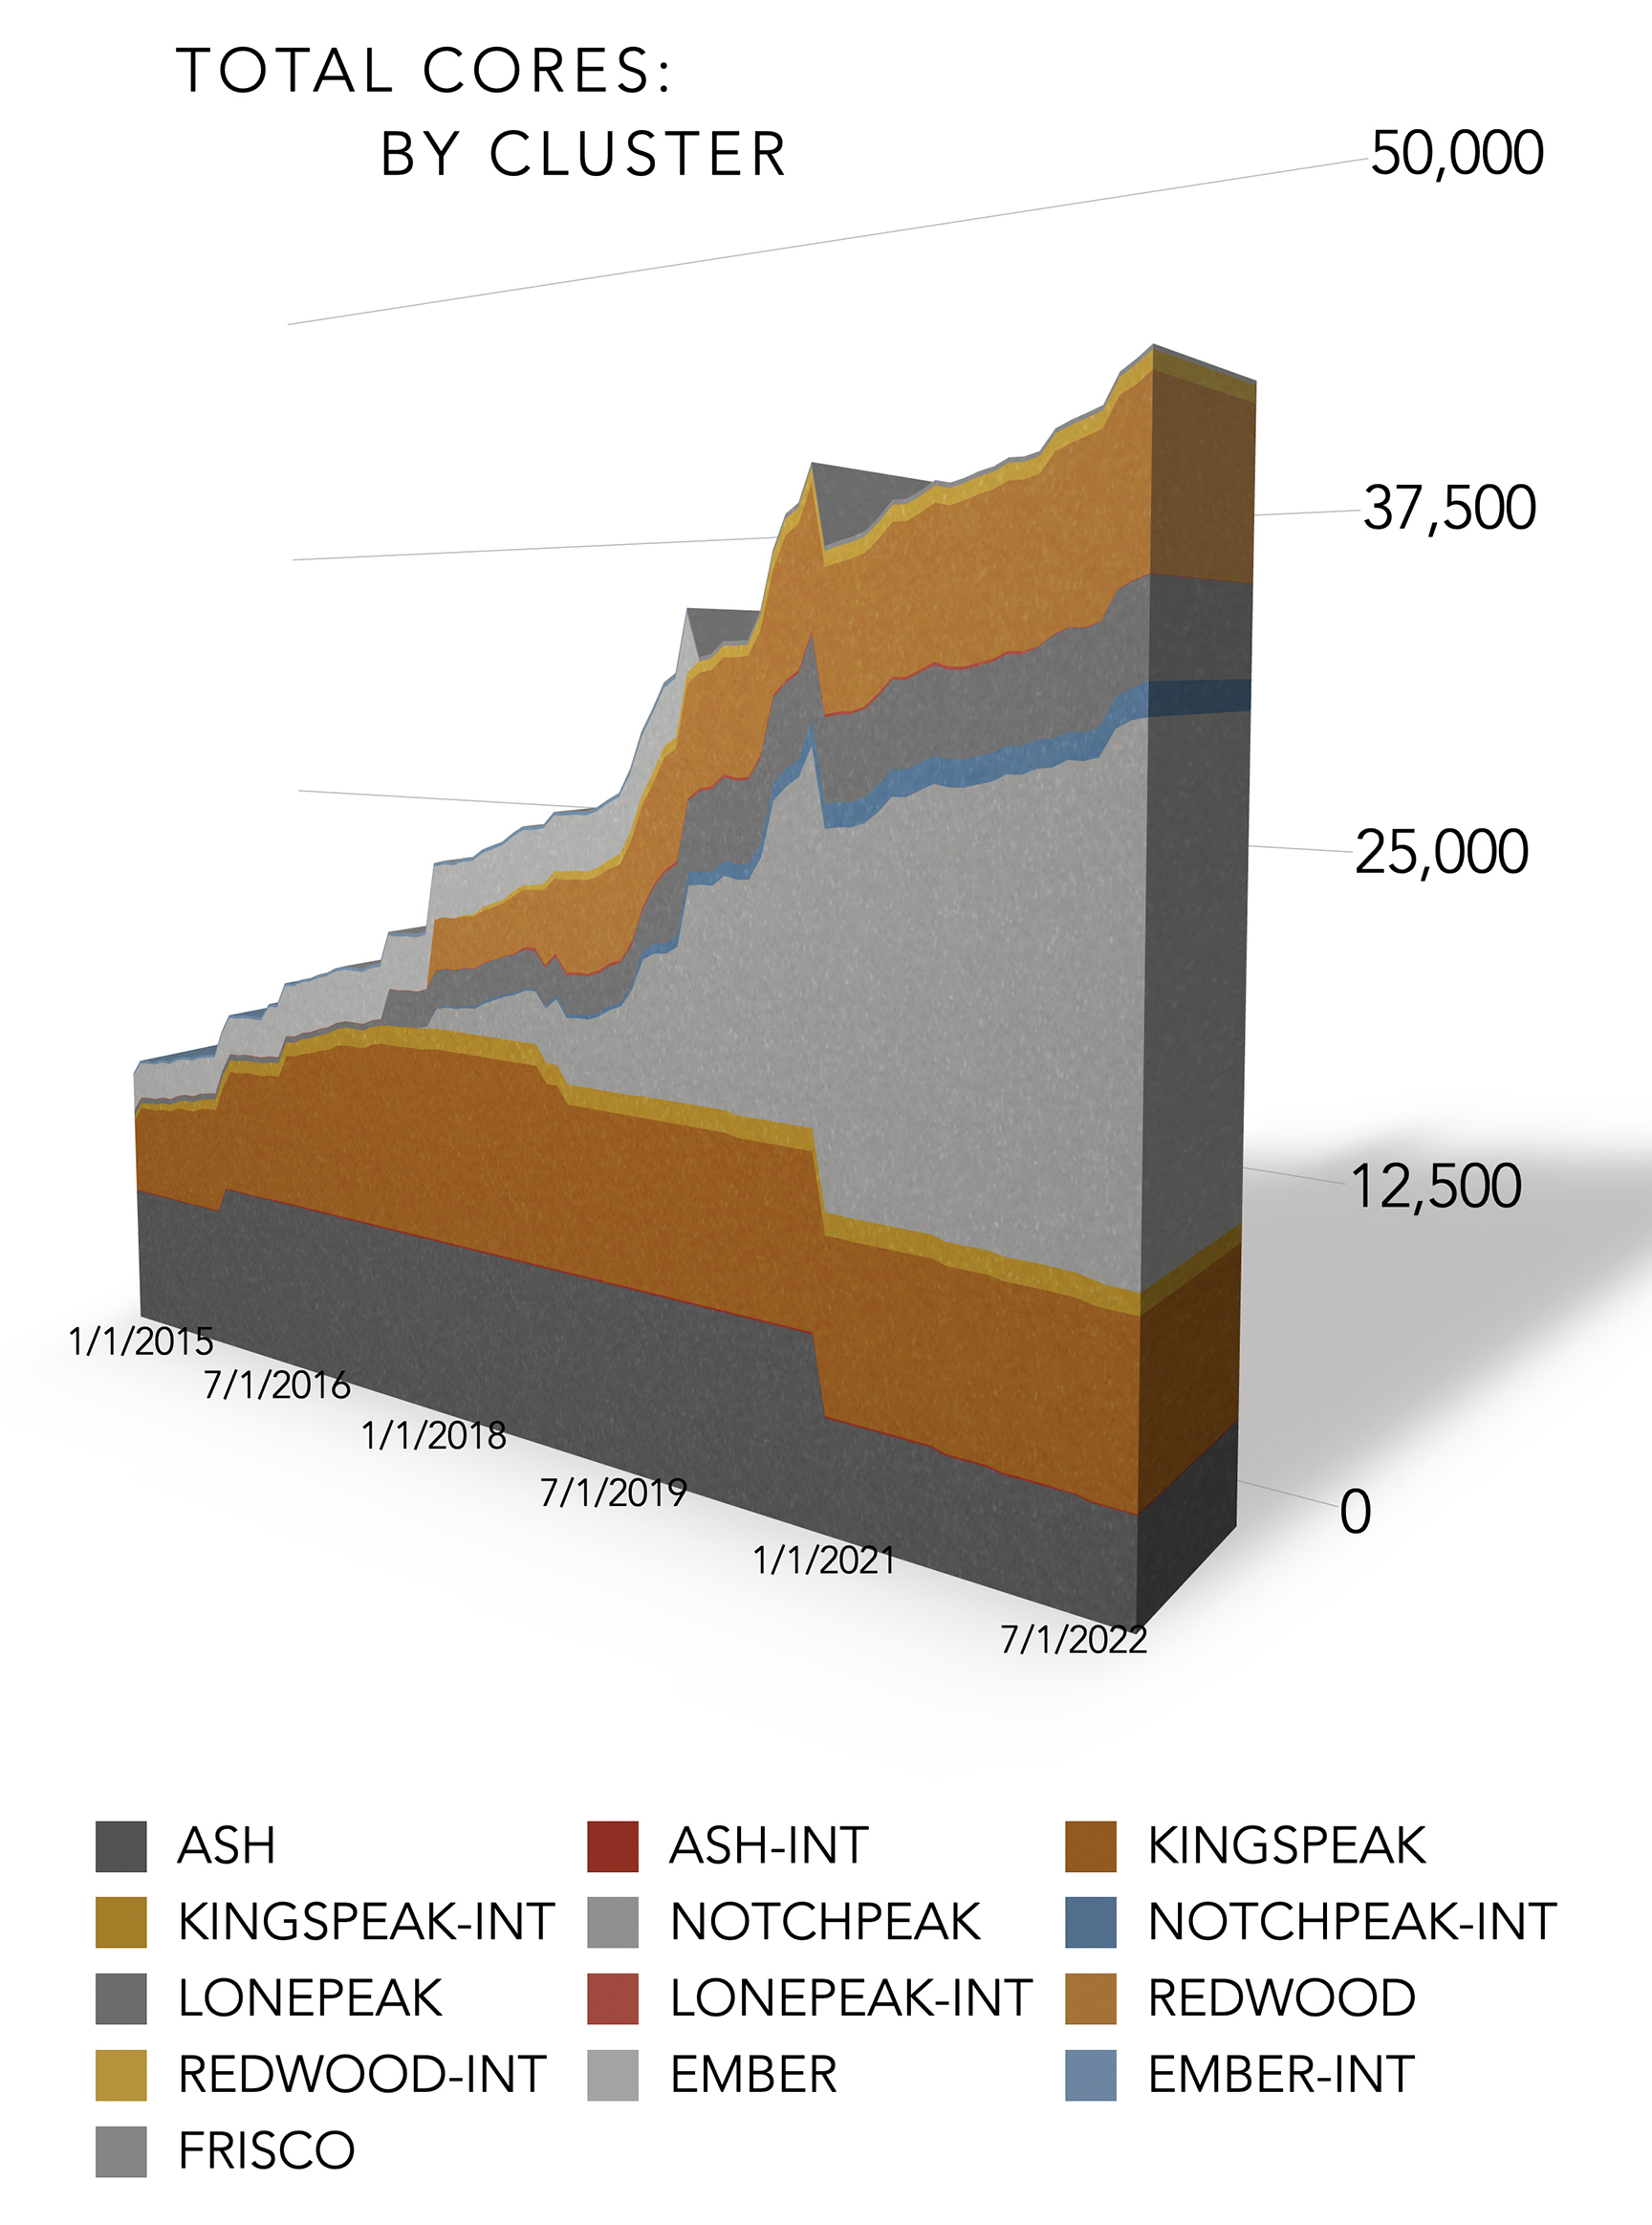
CHPC Metrics: Total Cores: By Cluster
By CHPC Staff
The above graph shows the growth of the total number of cores per cluster.
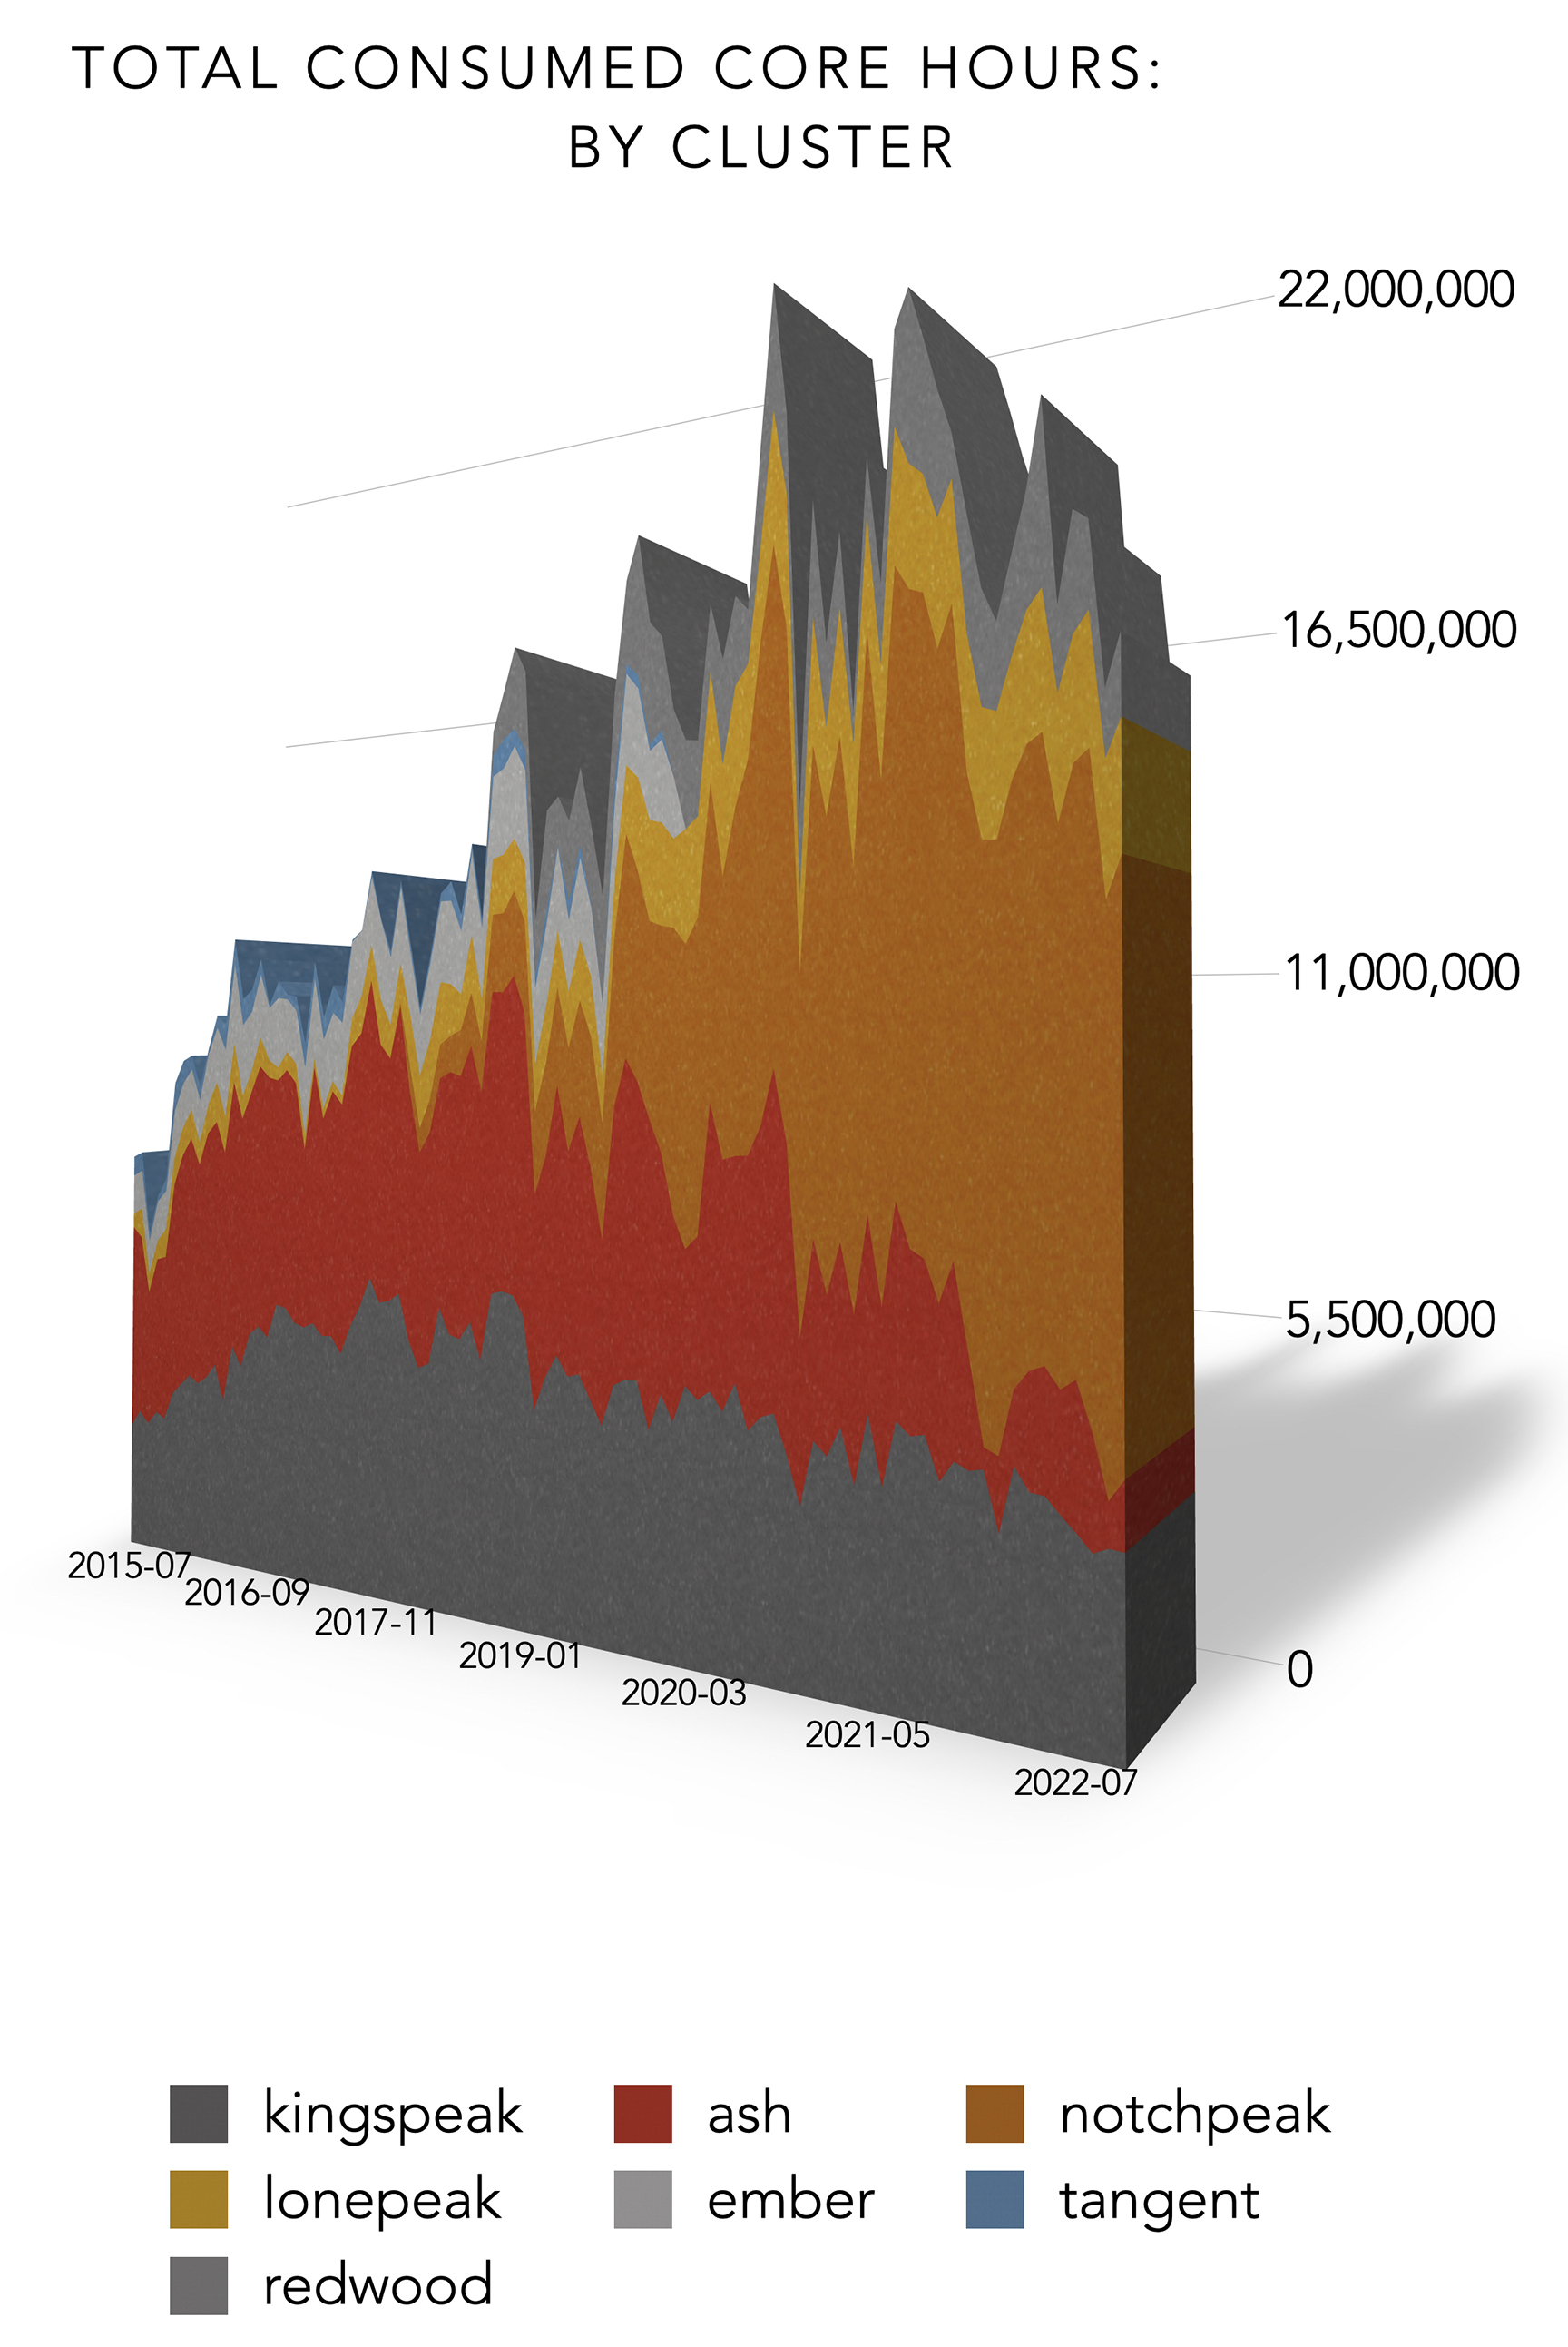
CHPC Metrics: Total Consumed Core Hours: By Cluster
By CHPC Staff
The above graph shows the growth in core hours used per month on all CHPC compute clusters, grouped by cluster.
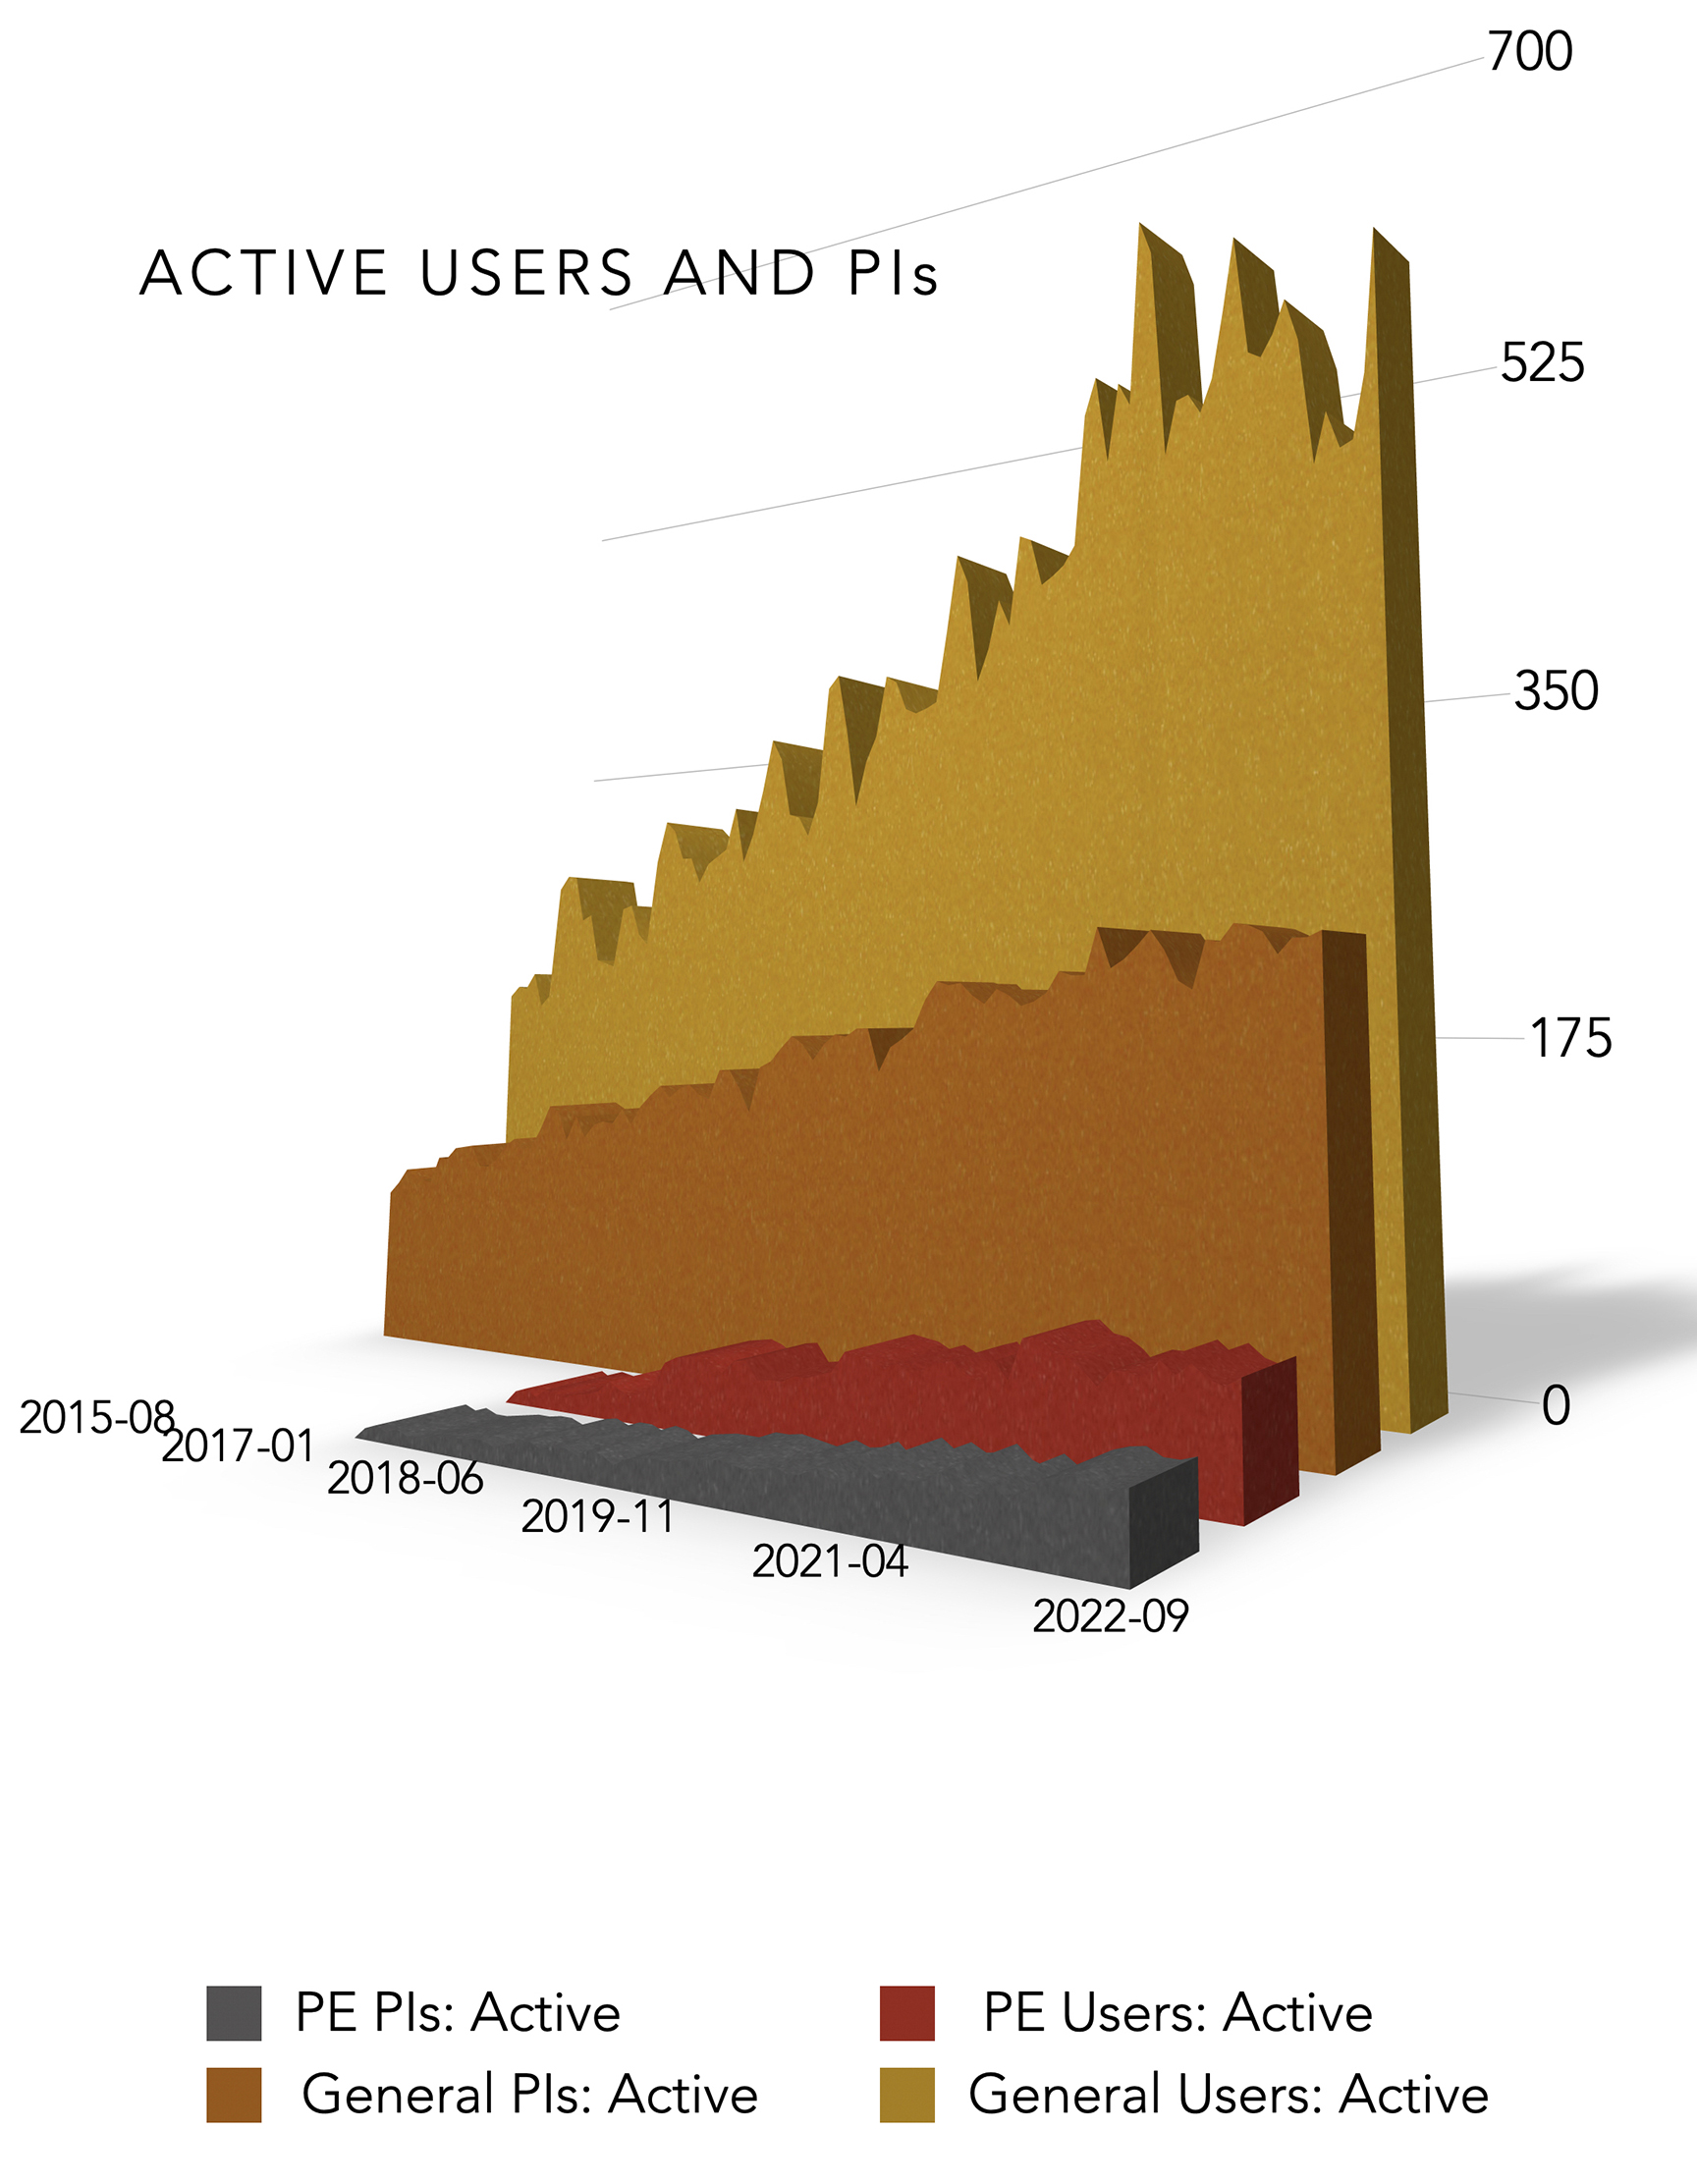
CHPC Metrics: Active Users and PIs
By CHPC Staff
The above graph shows the month to month growth in the number of groups (active PIs and users) making use of CHPC compute clusters. A group or user is active if they run at least one job during that month.
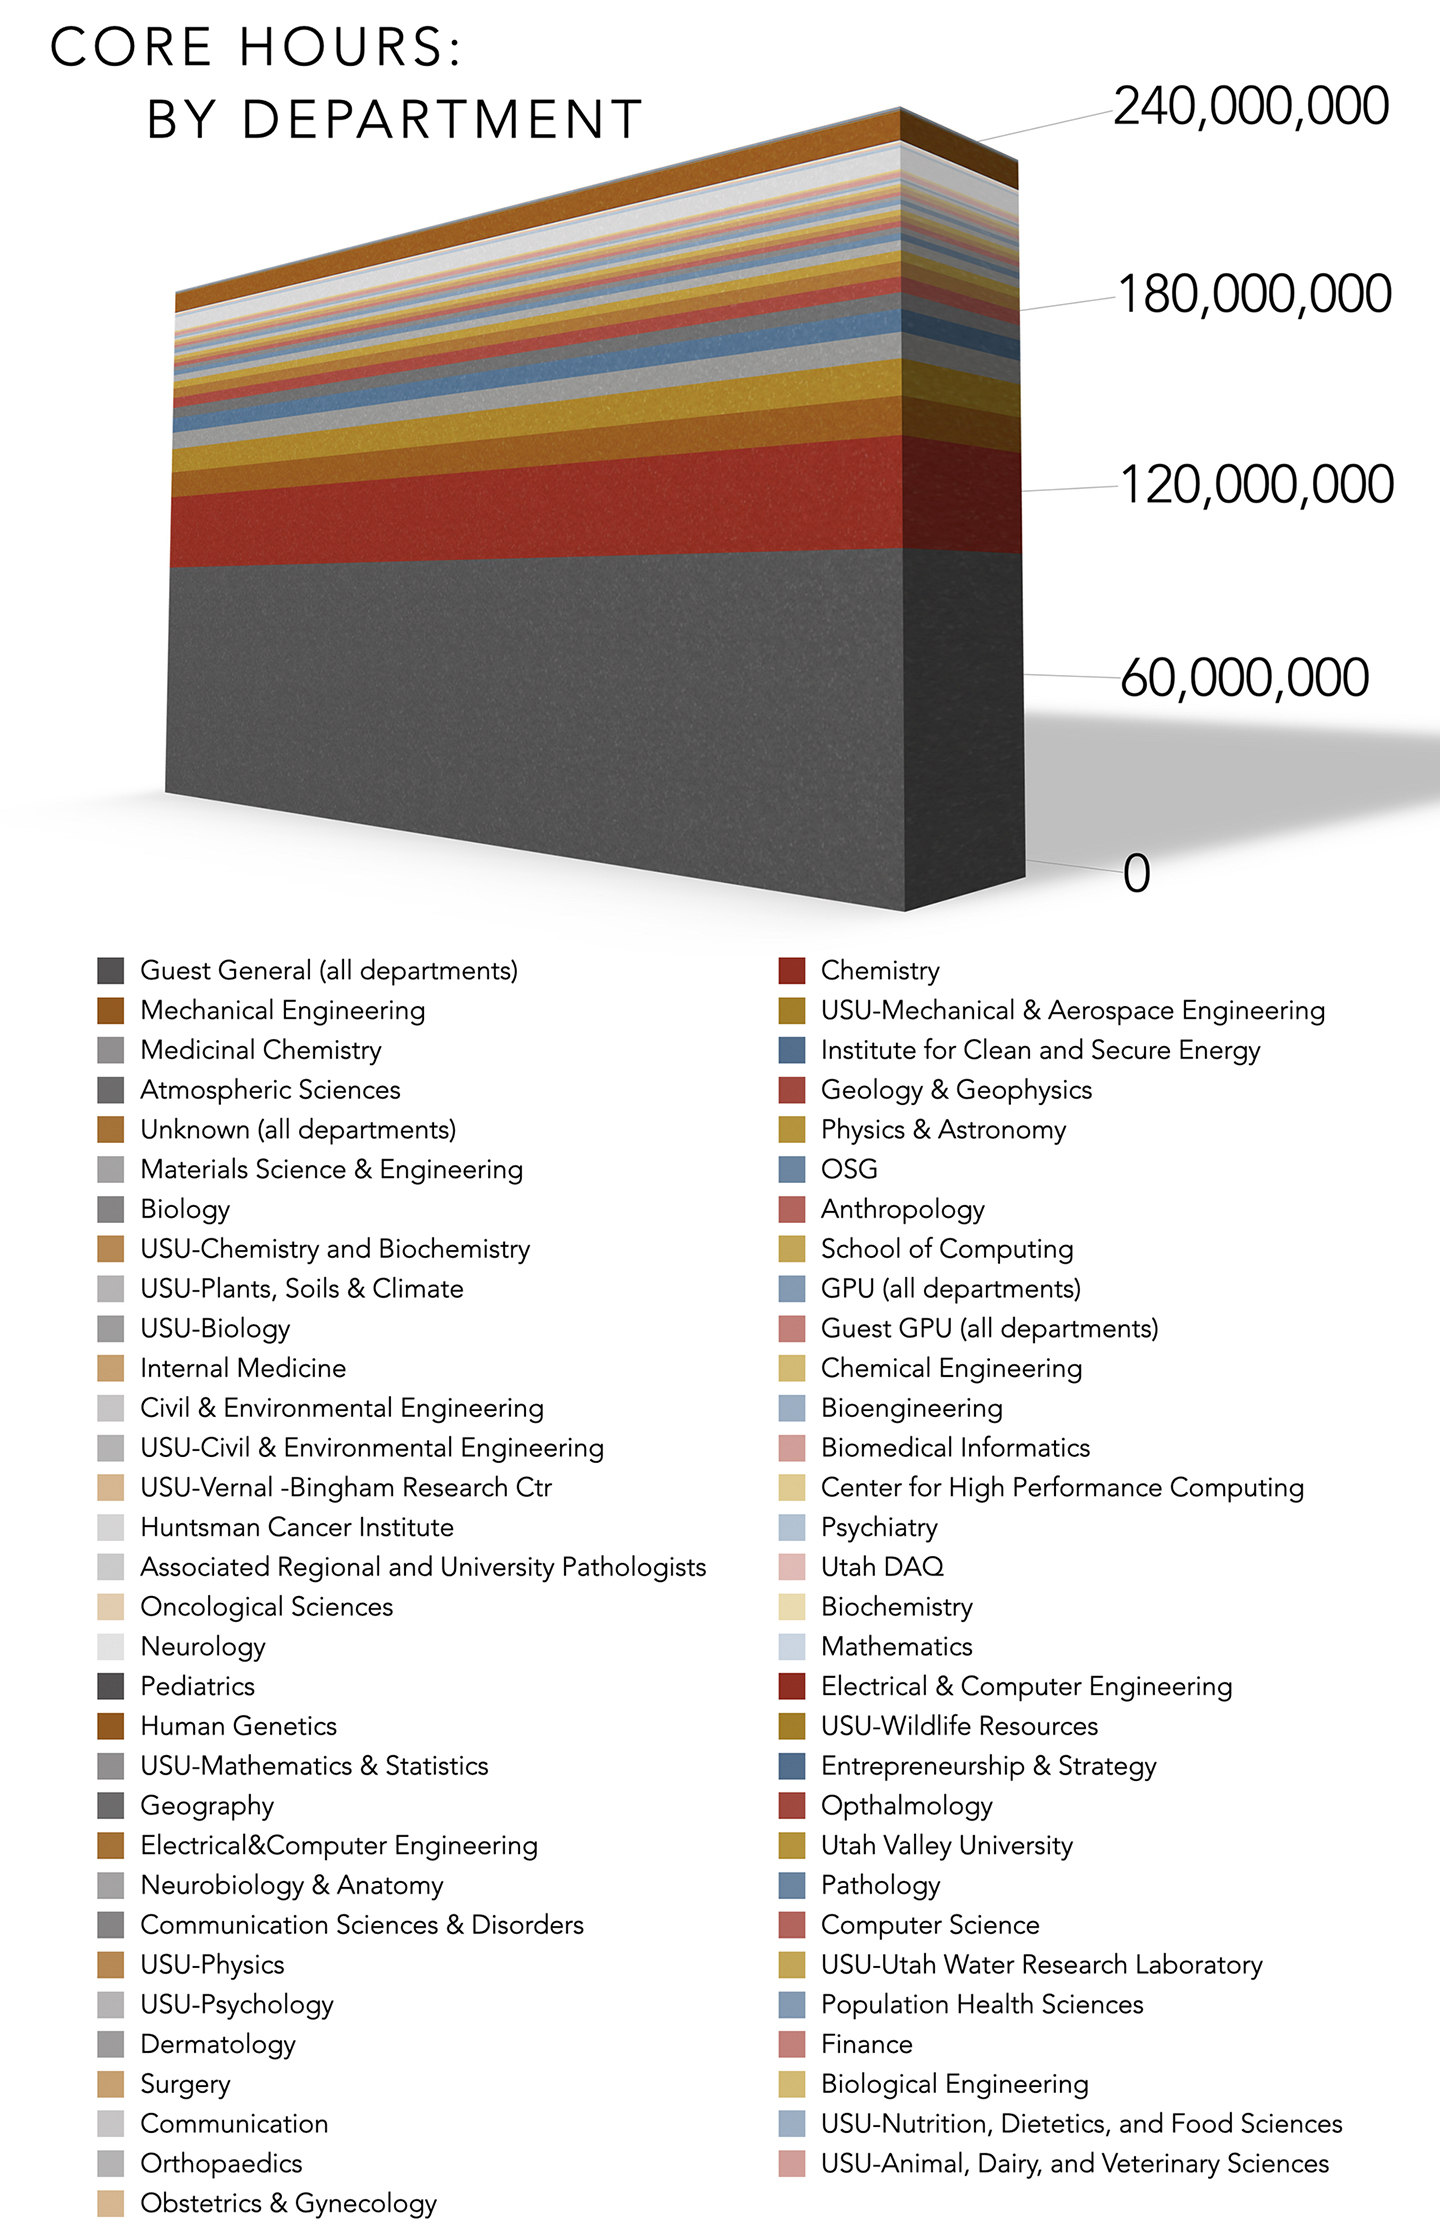
CHPC Metrics: Core Hours: By Department
By CHPC Staff
The above graph shows the breakdown in total core hours used from July 1, 2021 through June 30, 2022 on all CHPC compute clusters, grouped by University department.
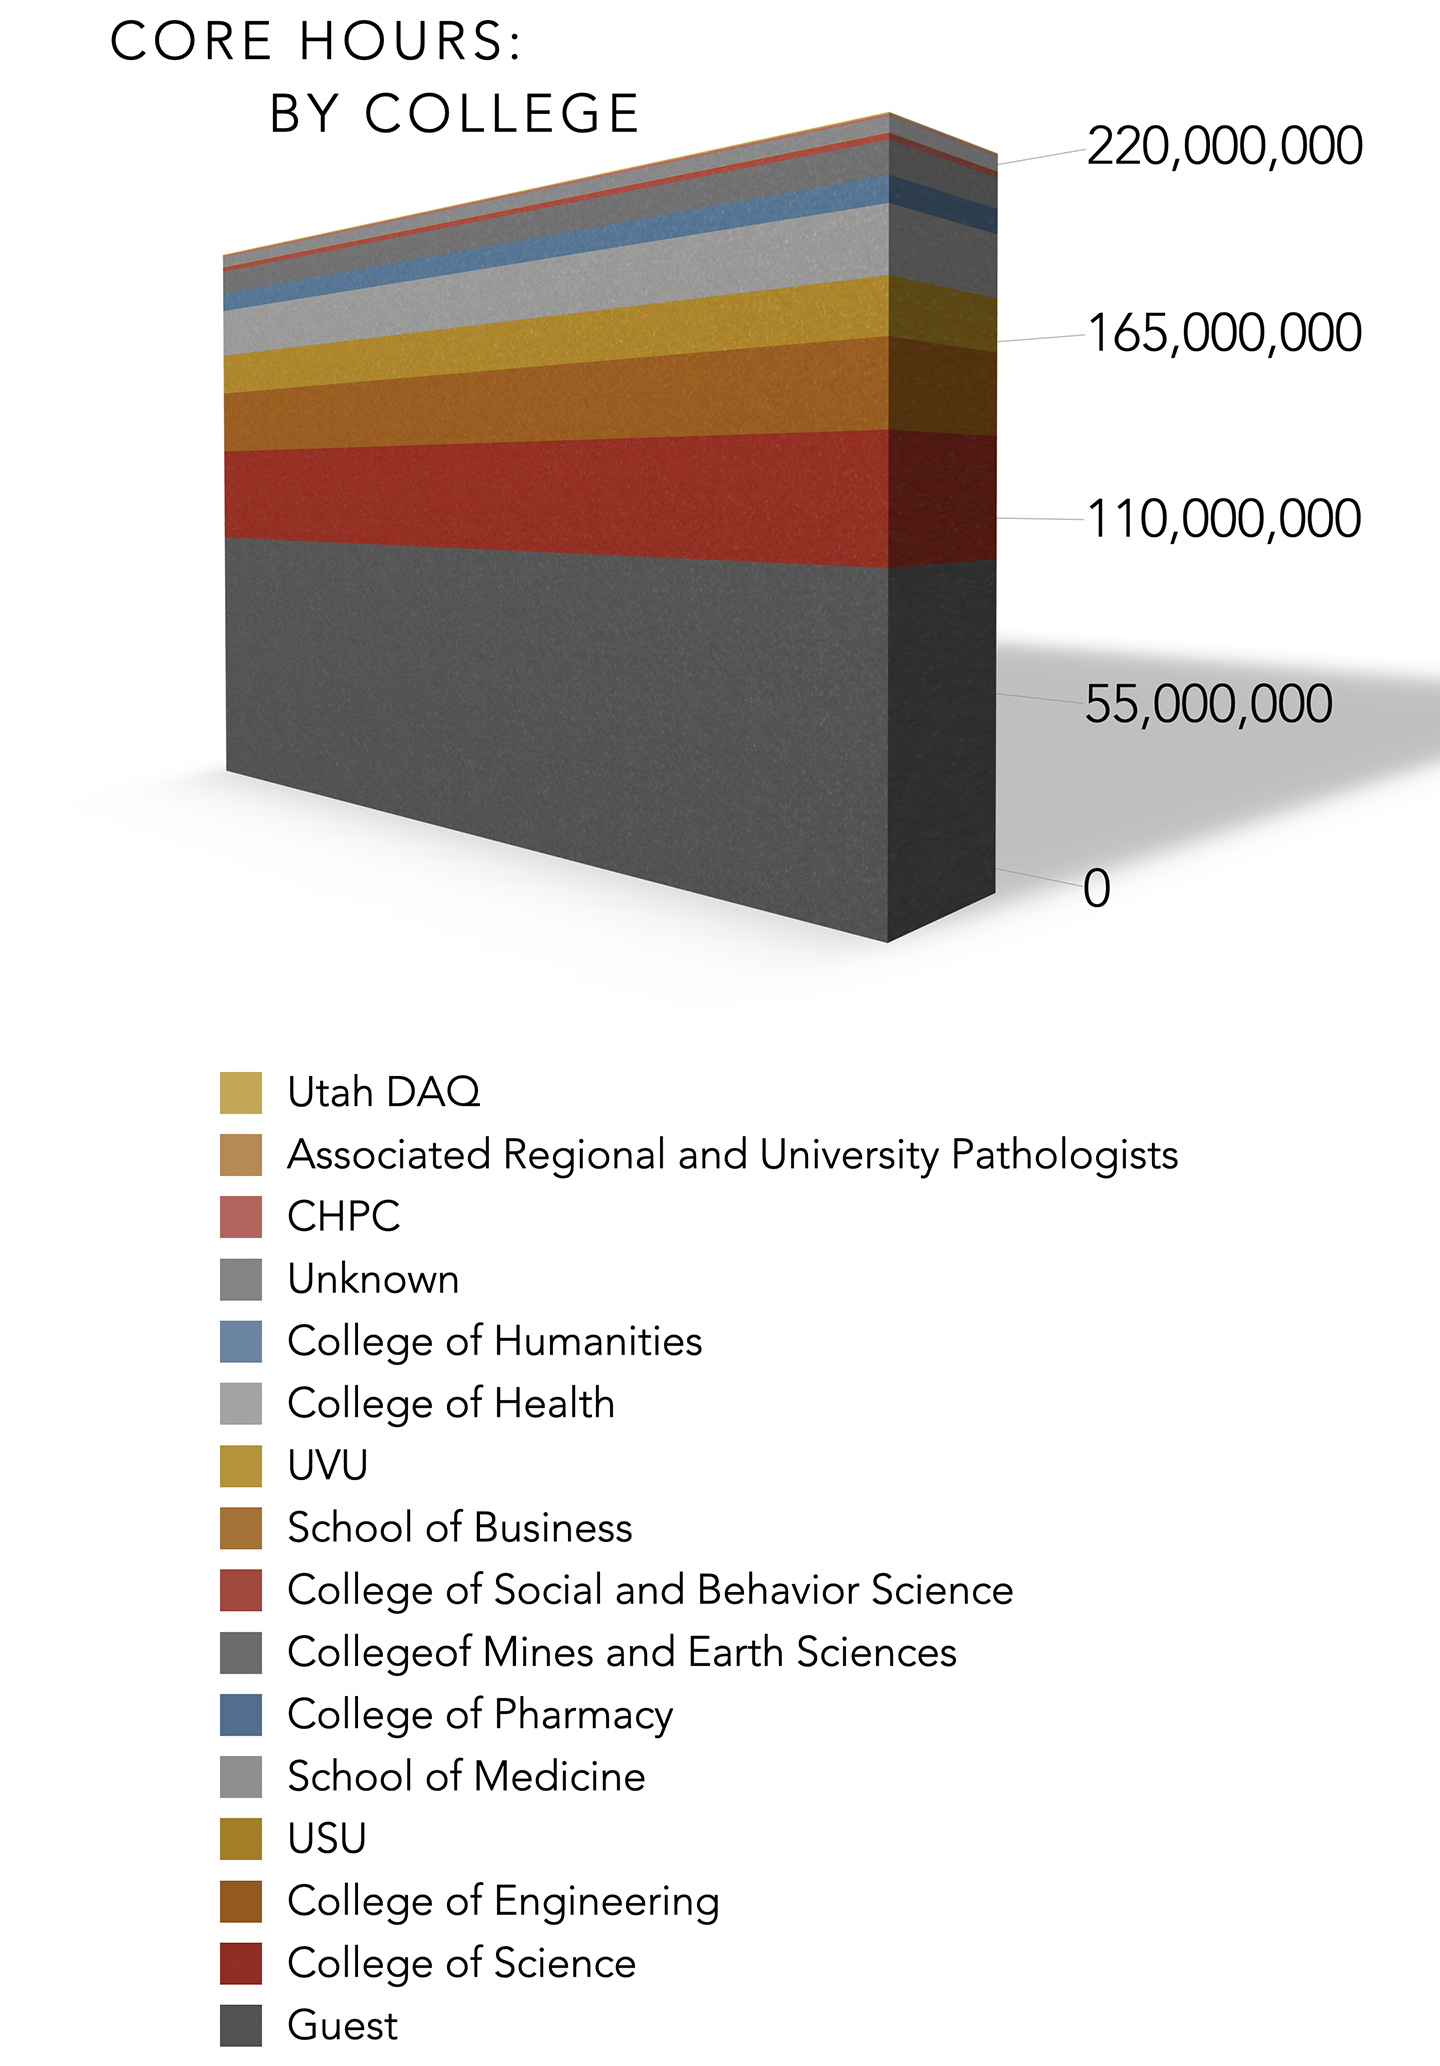
CHPC Metrics: Core Hours: By College
By CHPC Staff
The above graph shows the breakdown in total core hours used from July 1, 2021 through June 30, 2022 on all CHPC compute clusters, grouped by University college.
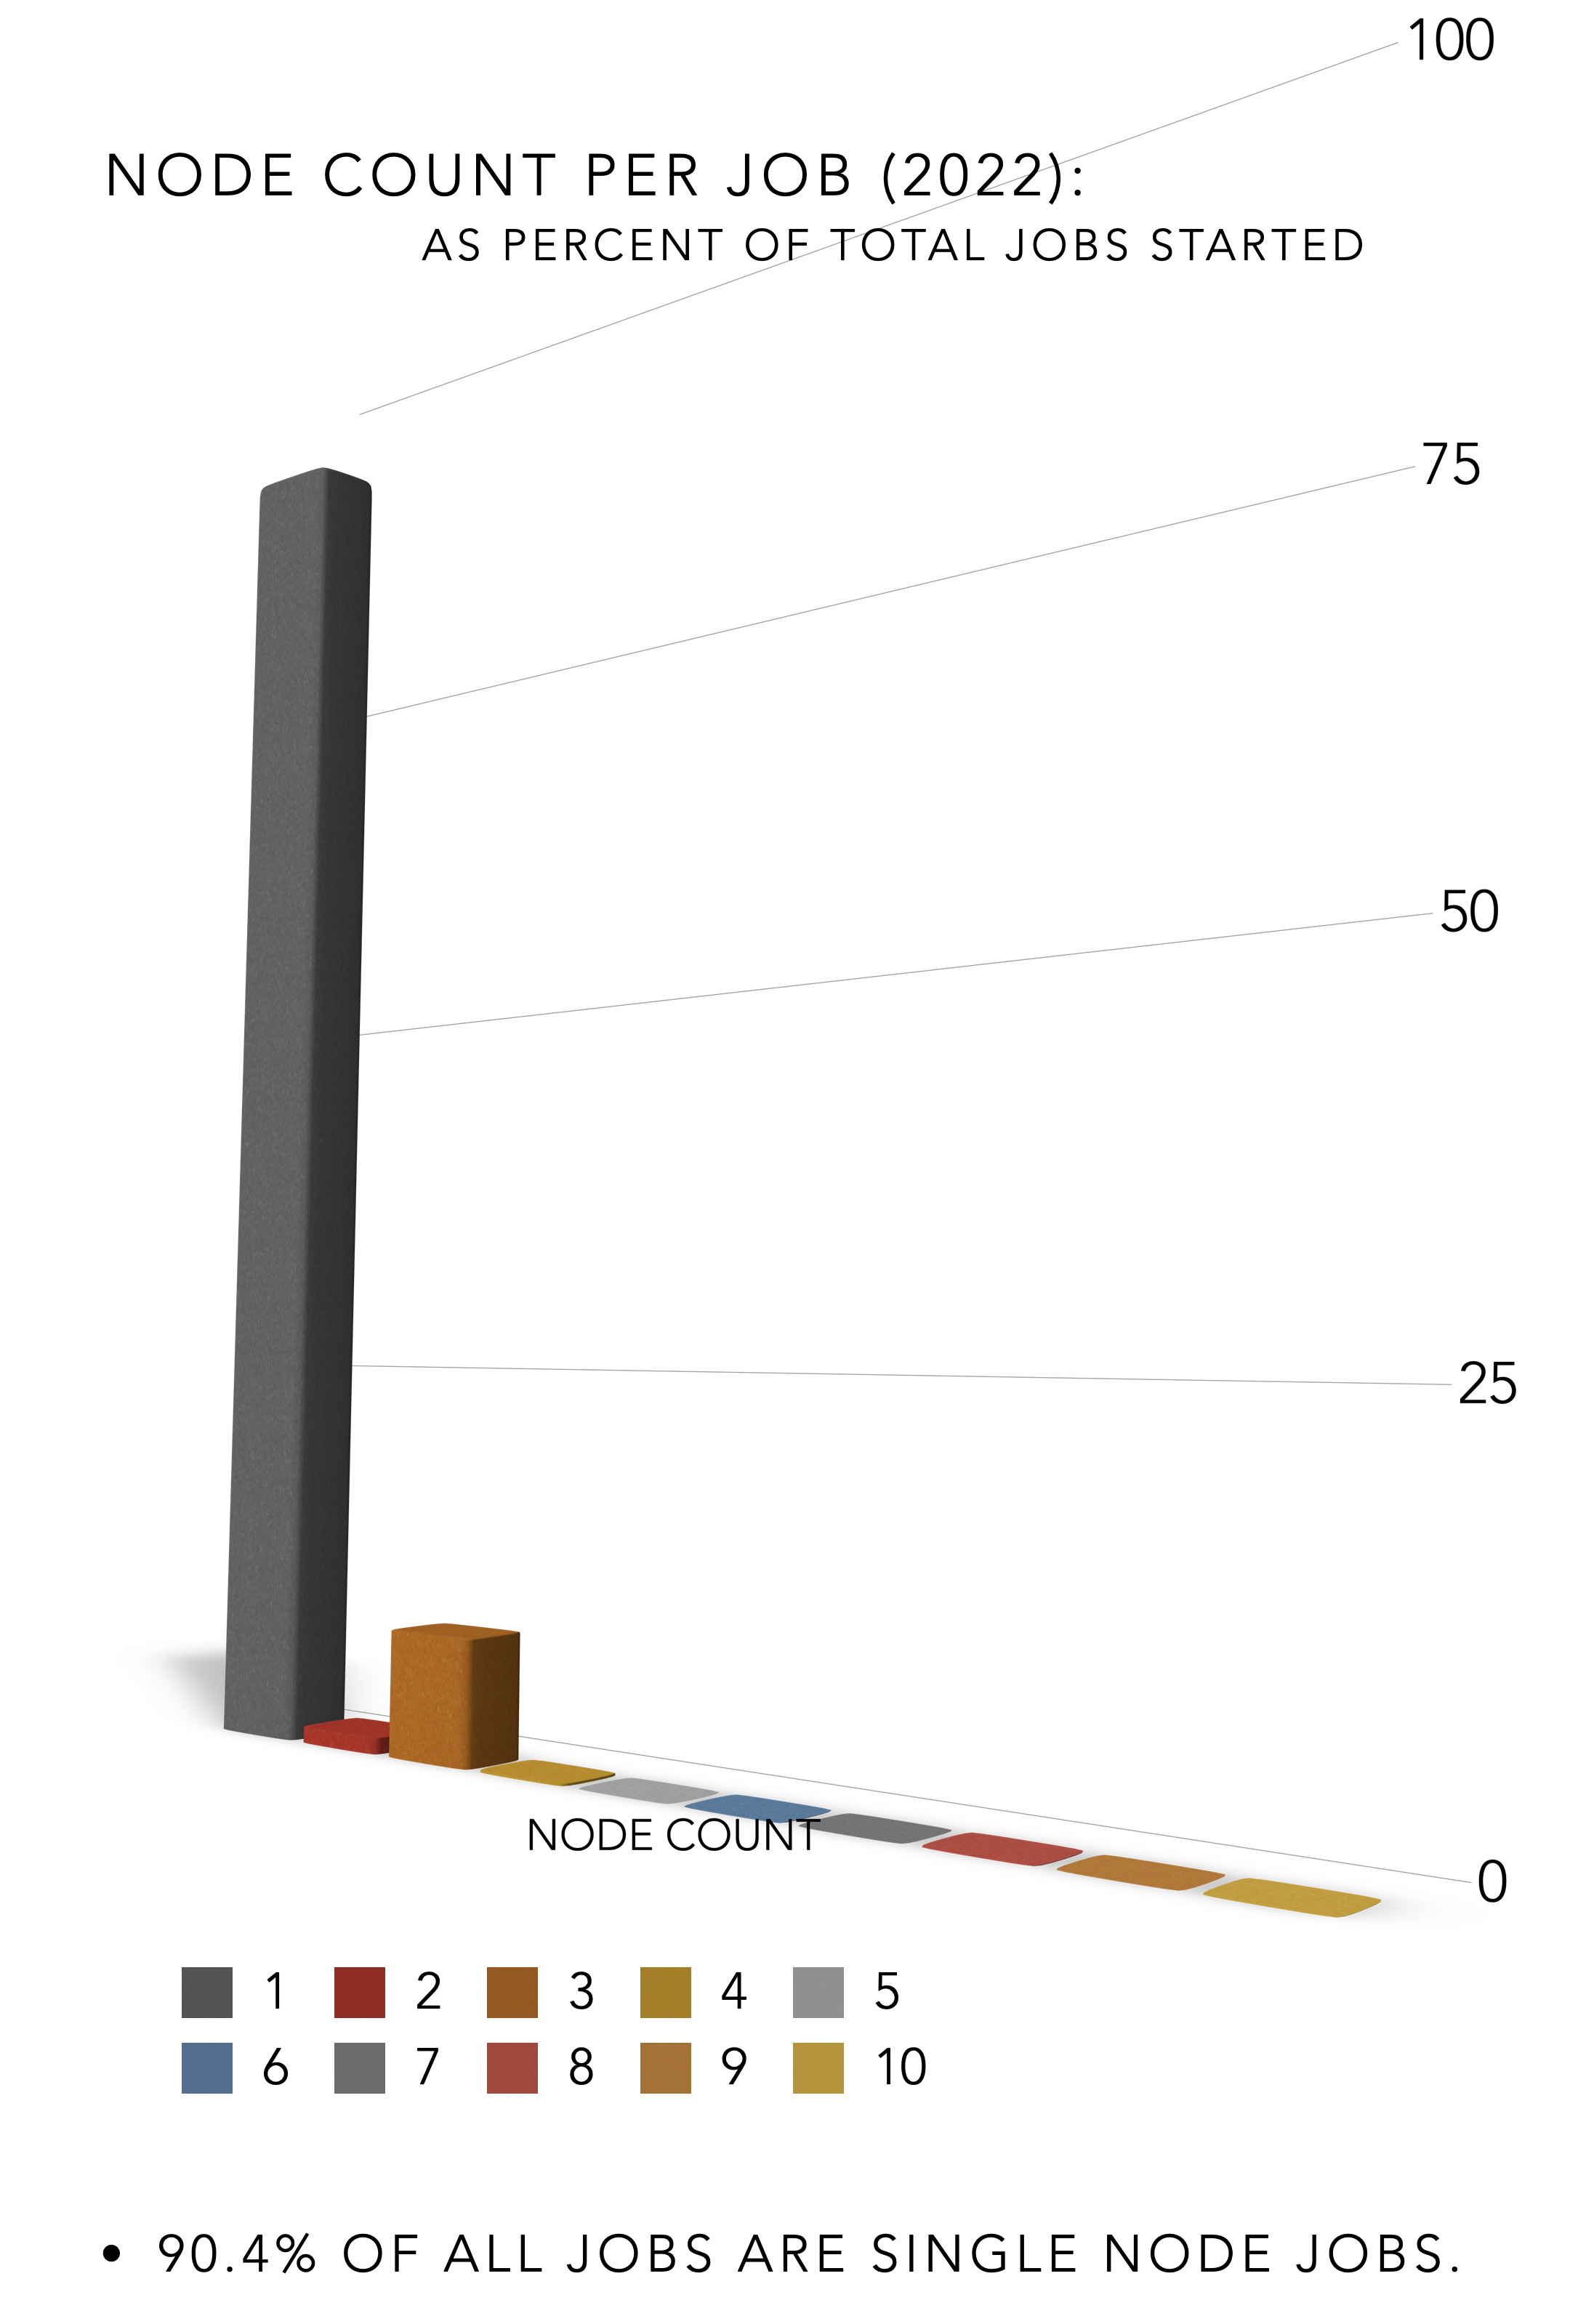
CHPC Metrics: Node Count Per Job As Percent of Total Jobs Started
By CHPC Staff
The above graph shows the breakdown of jobs run January through October 2022 on the Notchpeak general partition as a function of the nodes per job, given as the percentage of total jobs started.
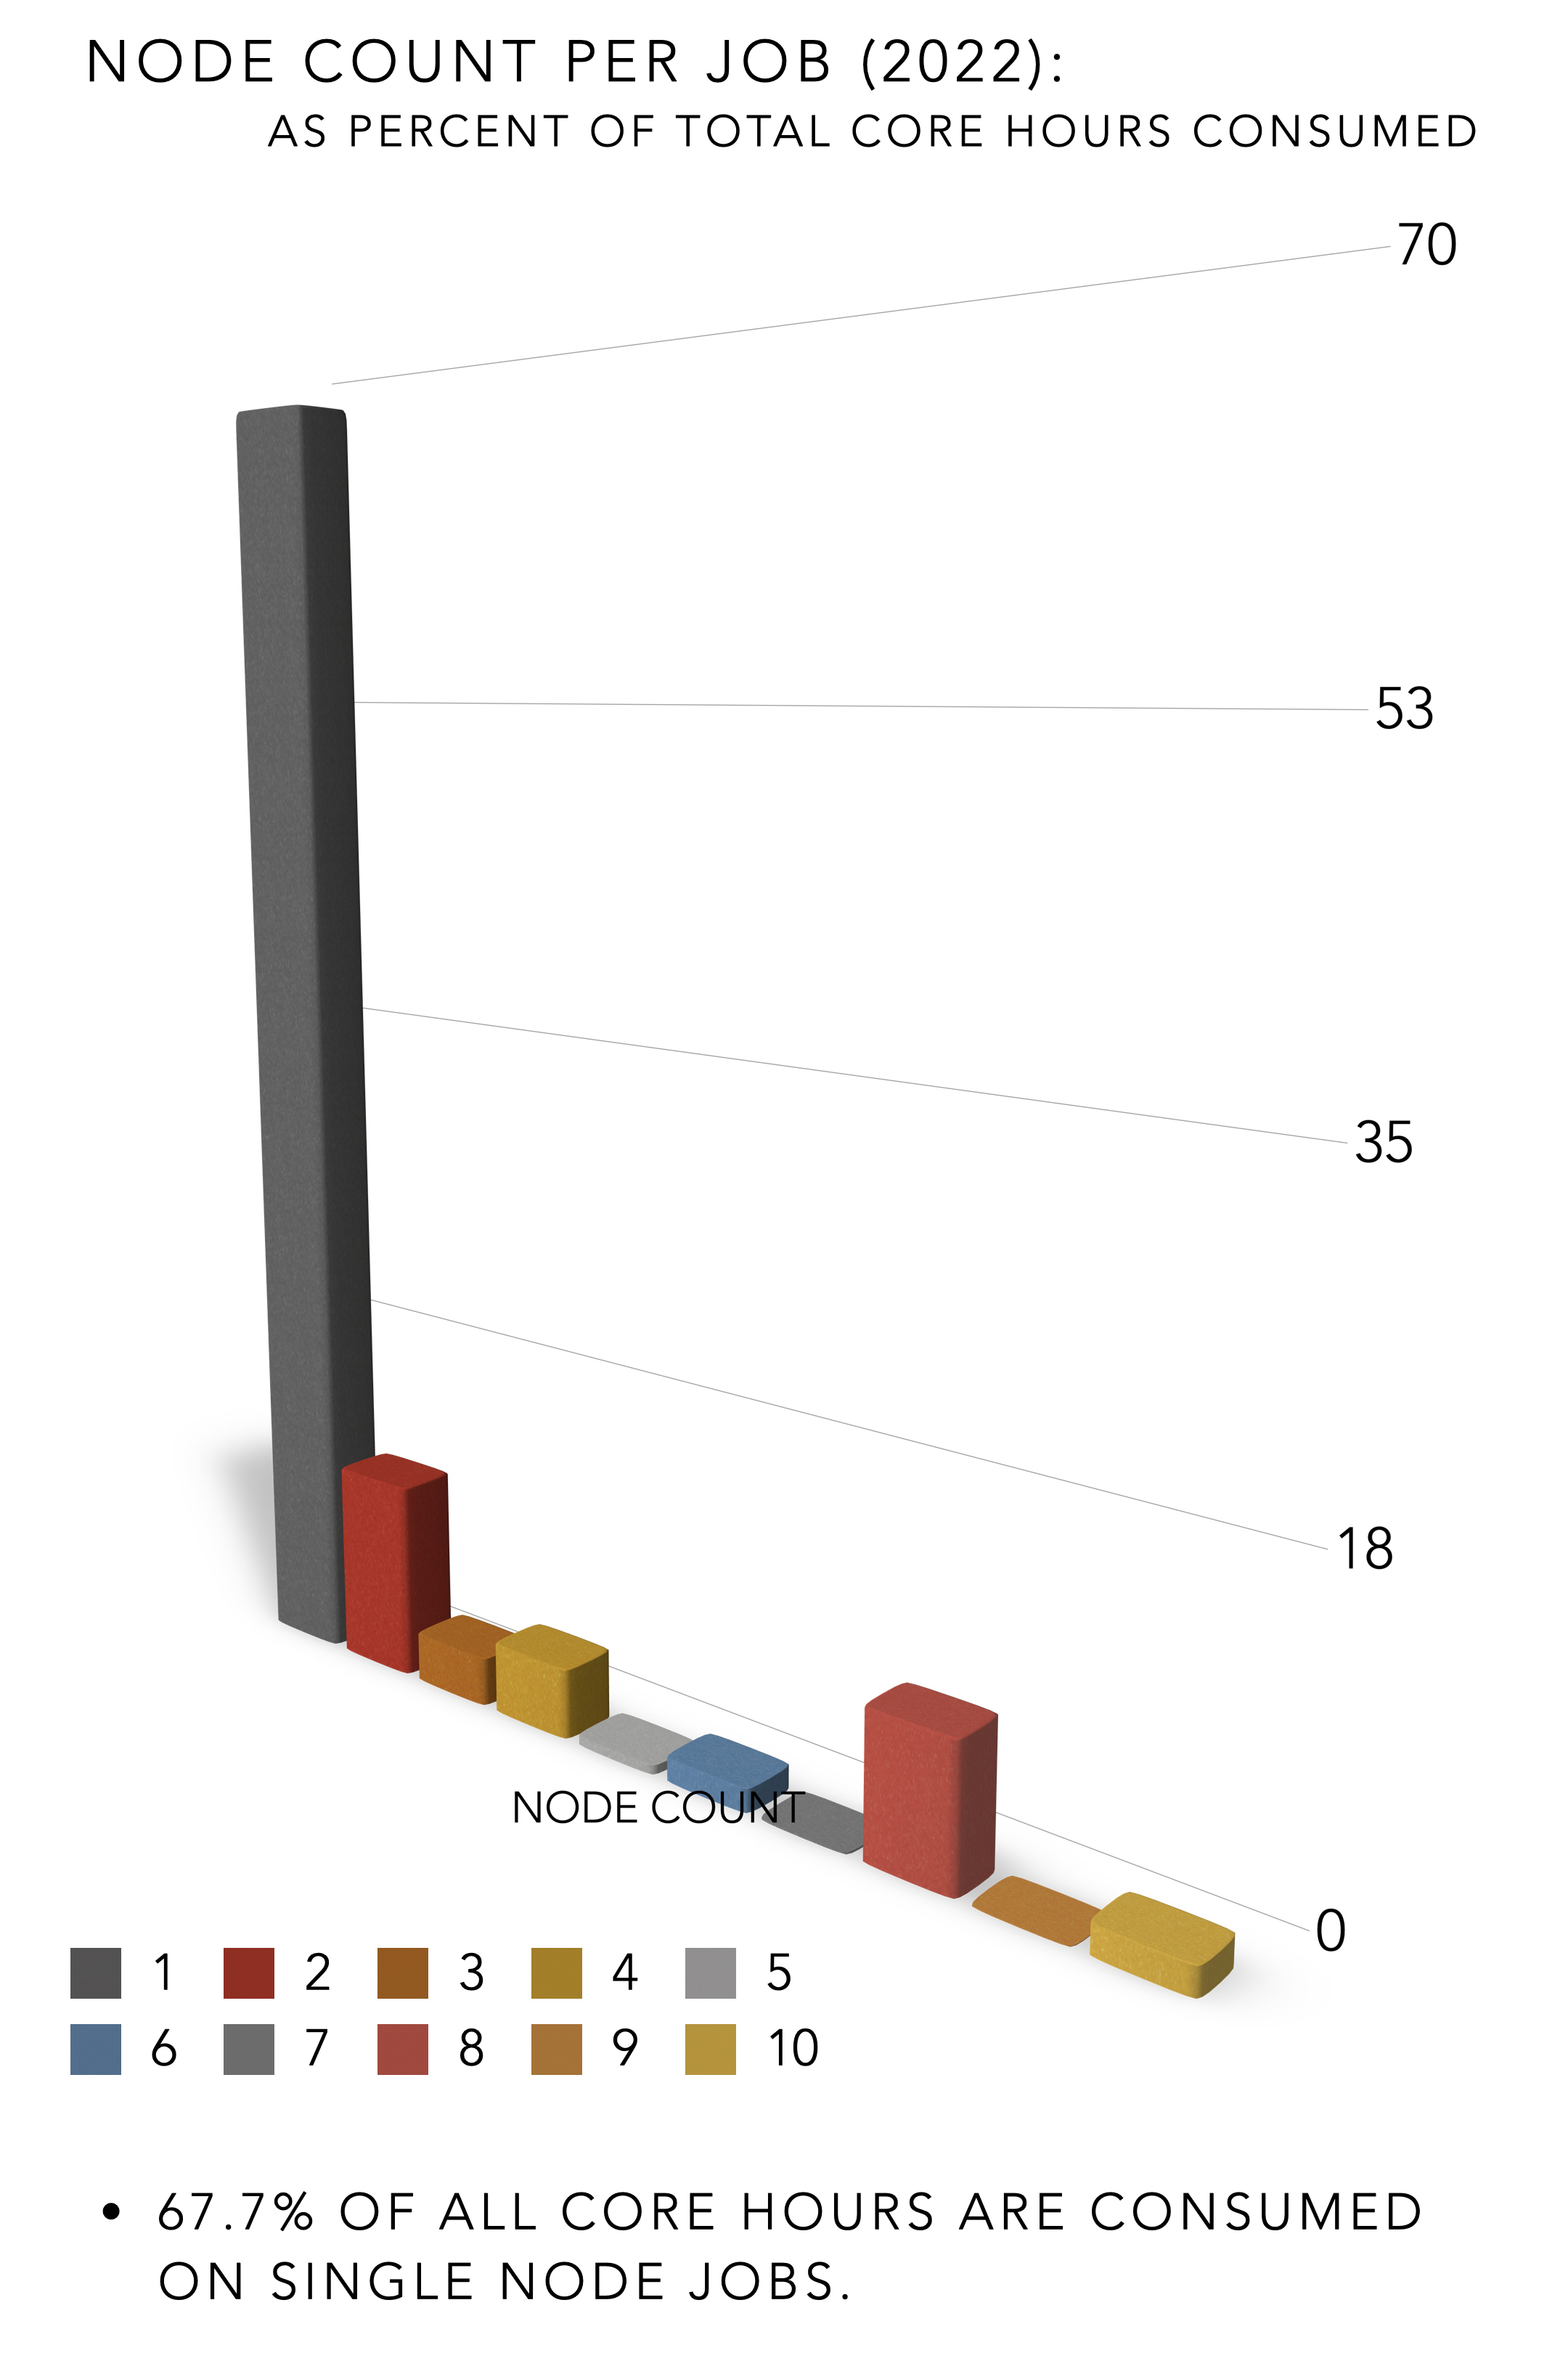
CHPC Metrics: Node Count Per Job As Percent of Total Core Hours Consumed
By CHPC Staff
The above graph shows the breakdown of jobs run January through October 2022 on the Notchpeak general partition as a function of the nodes per job, given as the percentage of total core hours consumed.
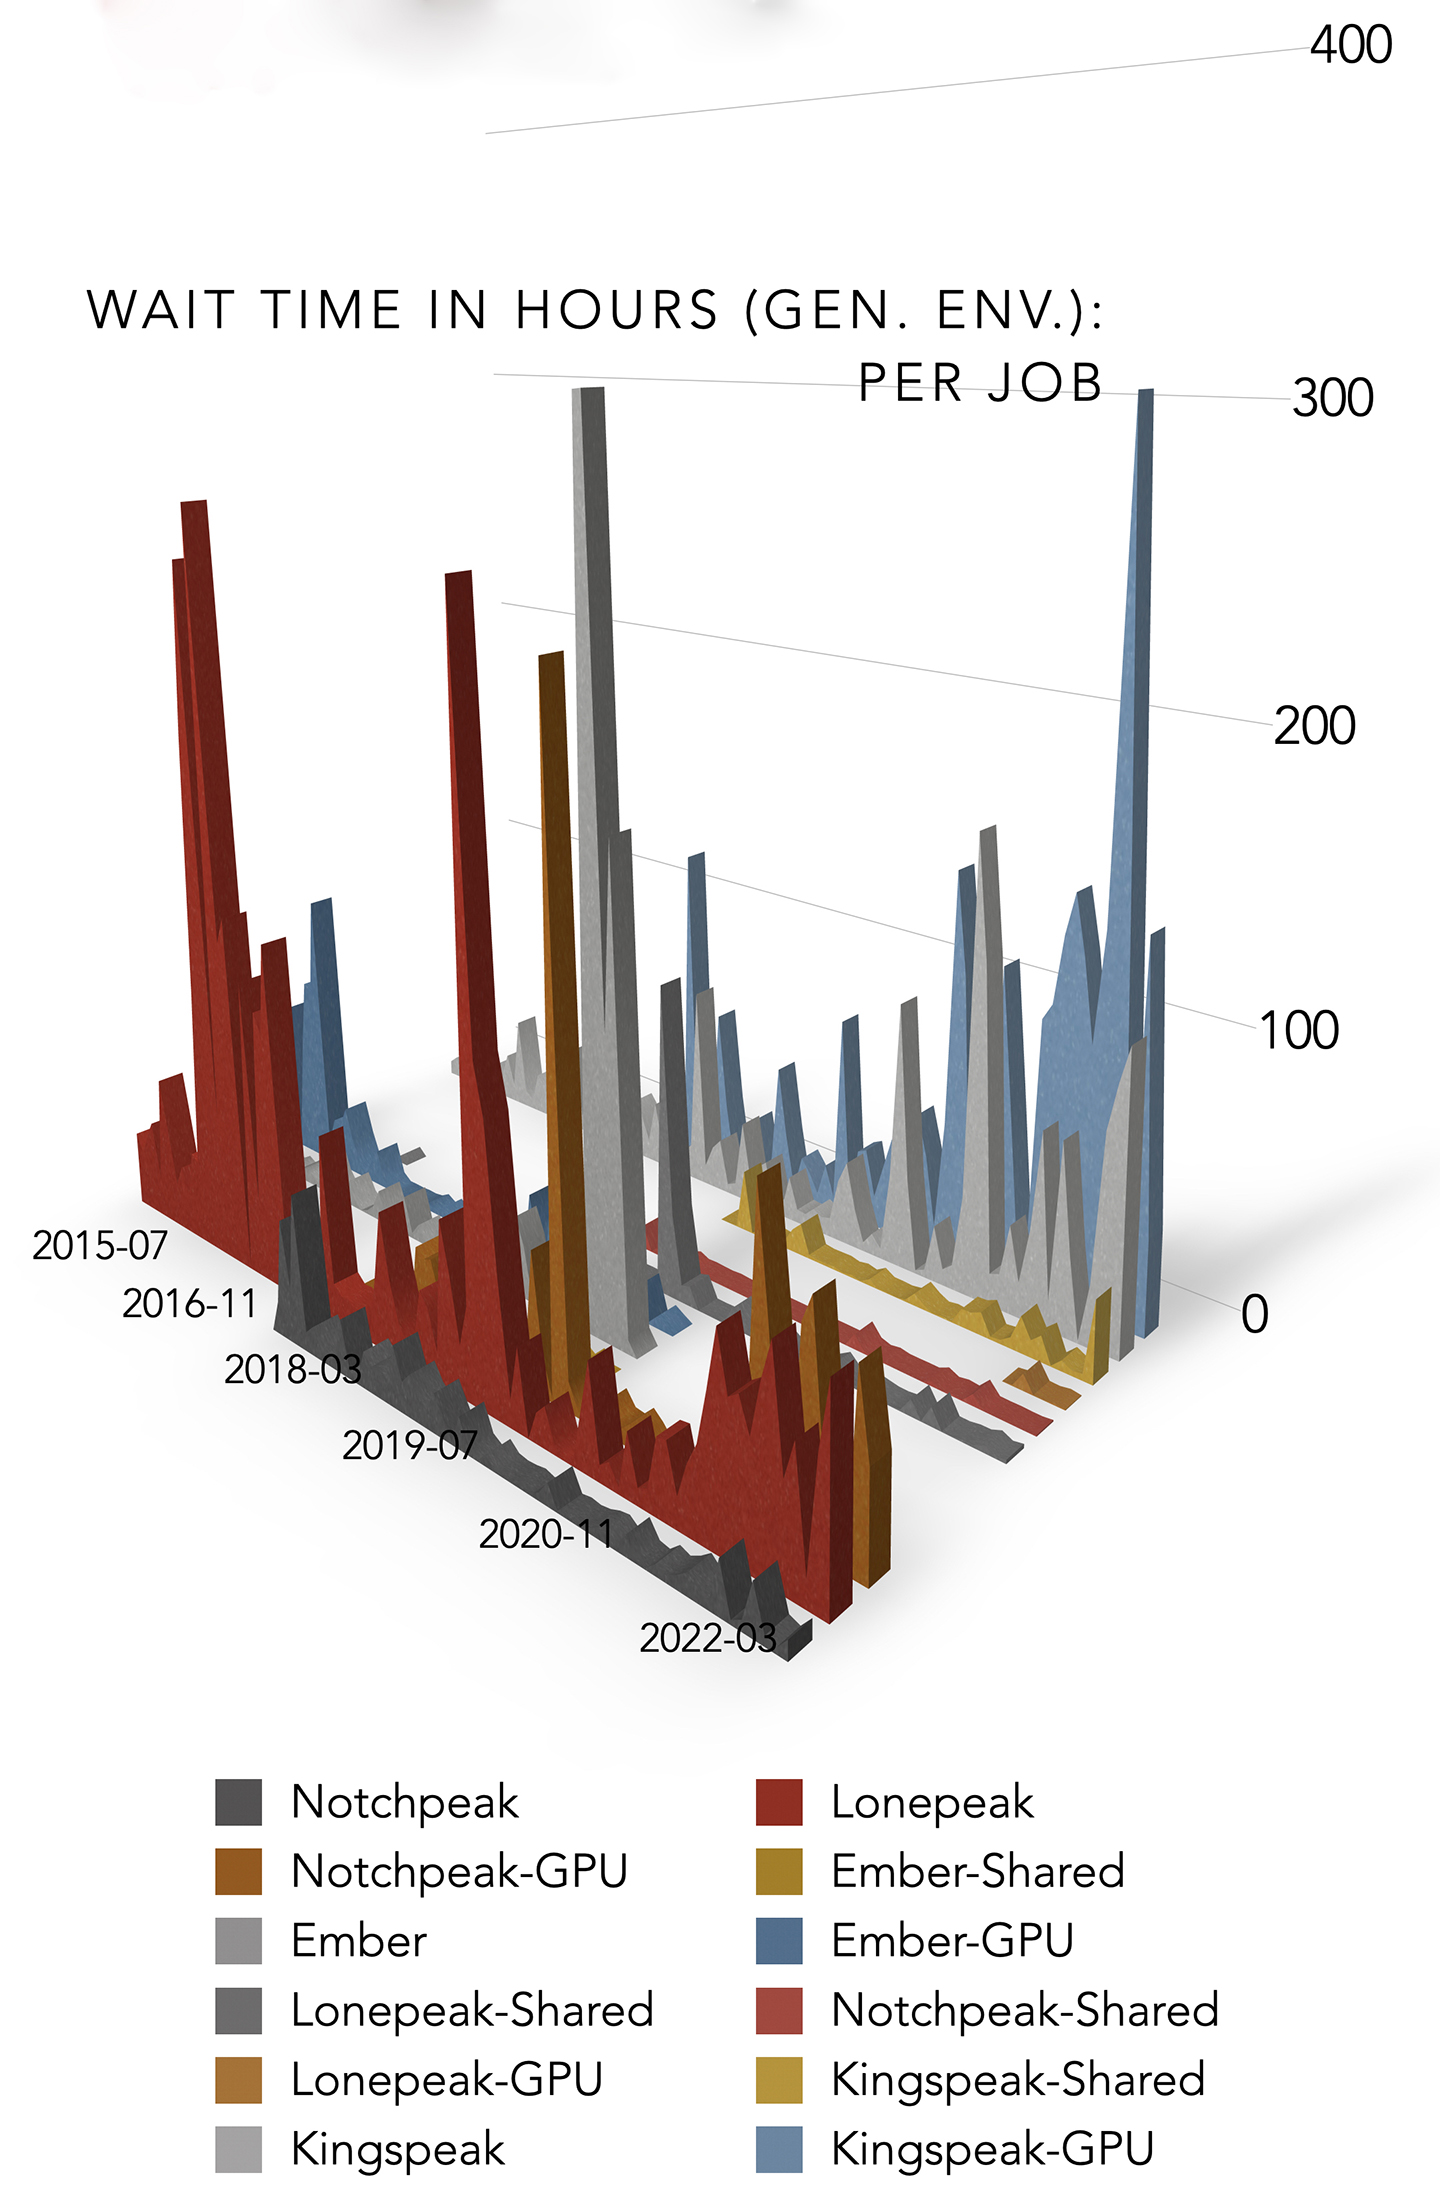
CHPC Metrics: Wait Time in Hours (GEN. ENV.): Per Job
By CHPC Staff
The above graph shows the job wait time in hours for all general partition jobs run between July 2015 and October 2022. The data is presented for each of the general partitions.
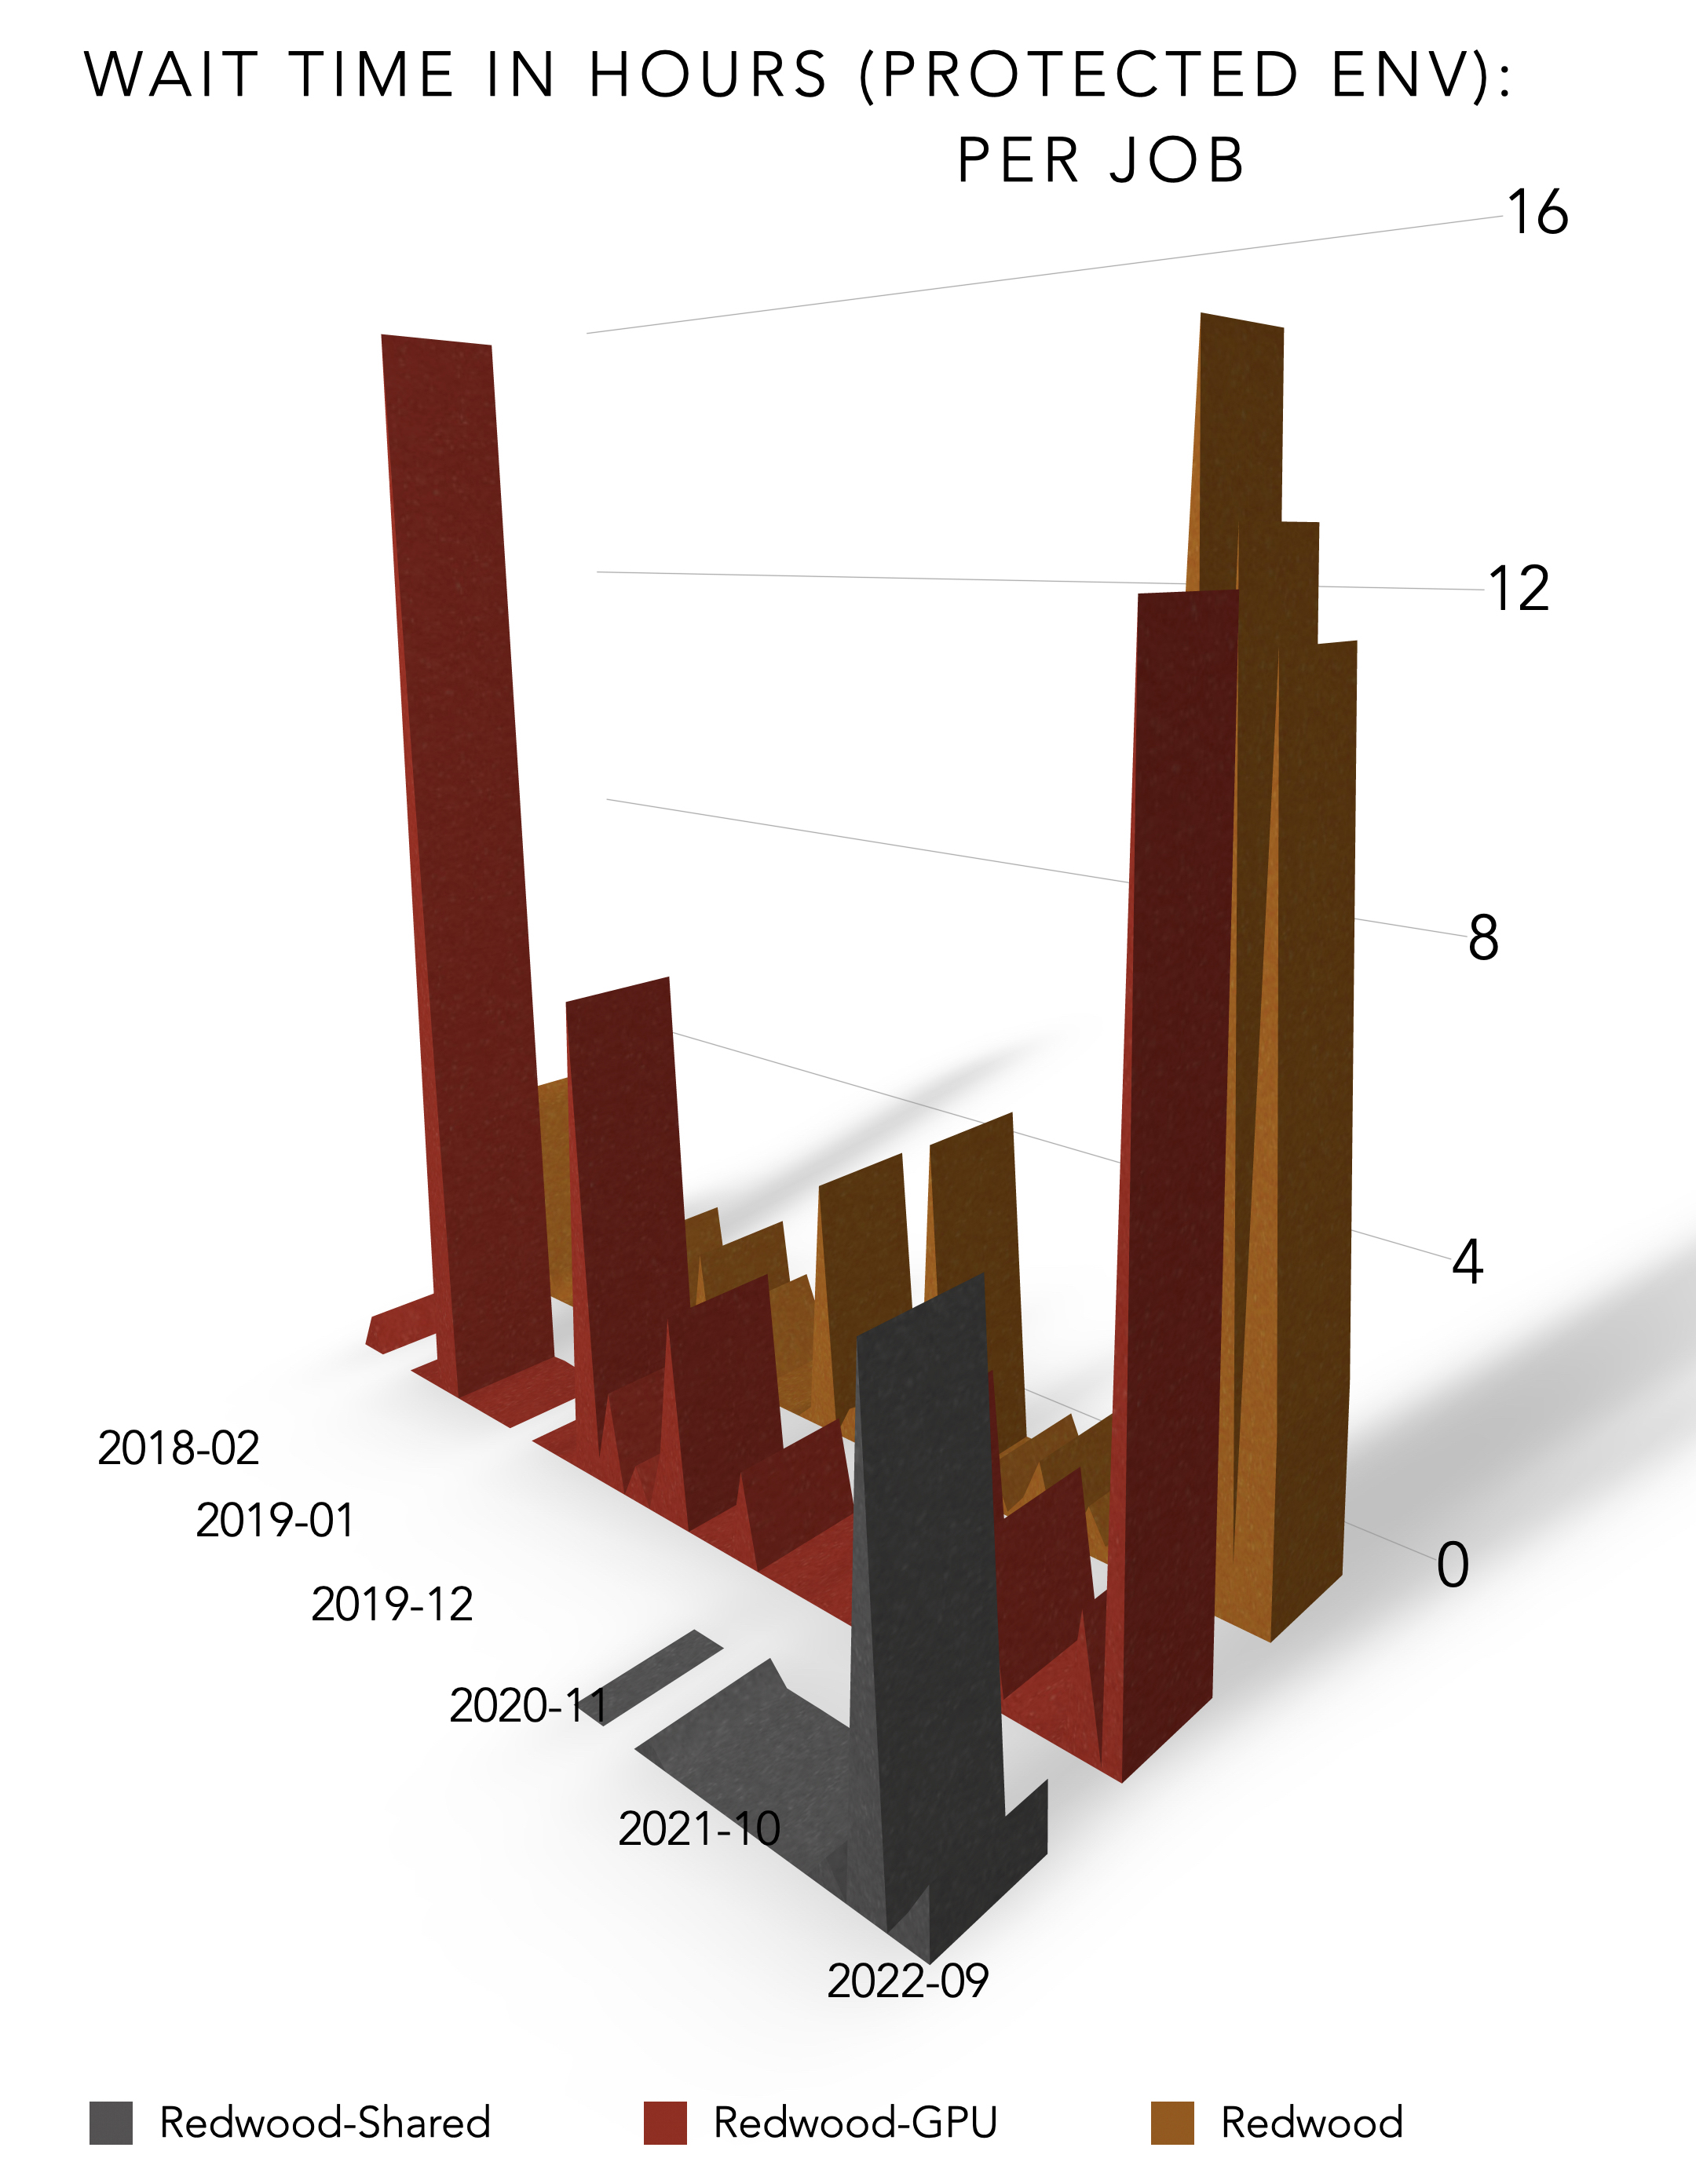
CHPC Metrics: Wait Time in Hours (Protected ENV.): Per Job
By CHPC Staff
The above graph shows the job wait time in hours for all of the general partition jobs on Redwood run between January 2018 and October 2022.
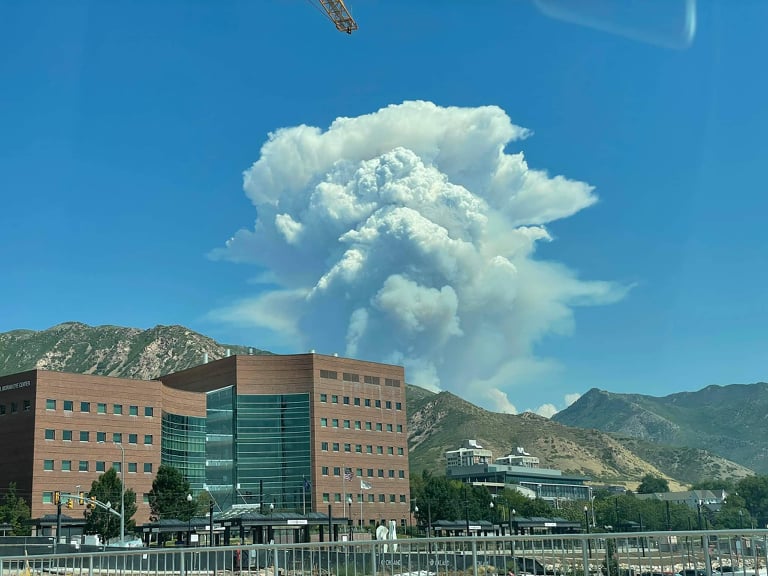
Identifying Major Wildfire Smoke Source Regions
By Taylor Wilmot, Derek Mallia, Gannet Hallar, John Lin
Department of Atmospheric Sciences, University of Utah
Using an atmospheric transport modeling framework, a wildfire plume rise model, and knowledge of wildfire smoke emission, we determined the extent to which wildfires are driving summertime air quality trends in 33 western US urban centers. Further, by directly linking smoke emissions from individual wildfires to air quality in specific urban centers, we were able to identify regionally dominant smoke source regions that frequently drive human exposure to degraded air quality. Broadly, we find that wildfires in mountainous California, the Southern Rockies, and portions of British Columbia are critical to understanding trends in smoke across the western US.
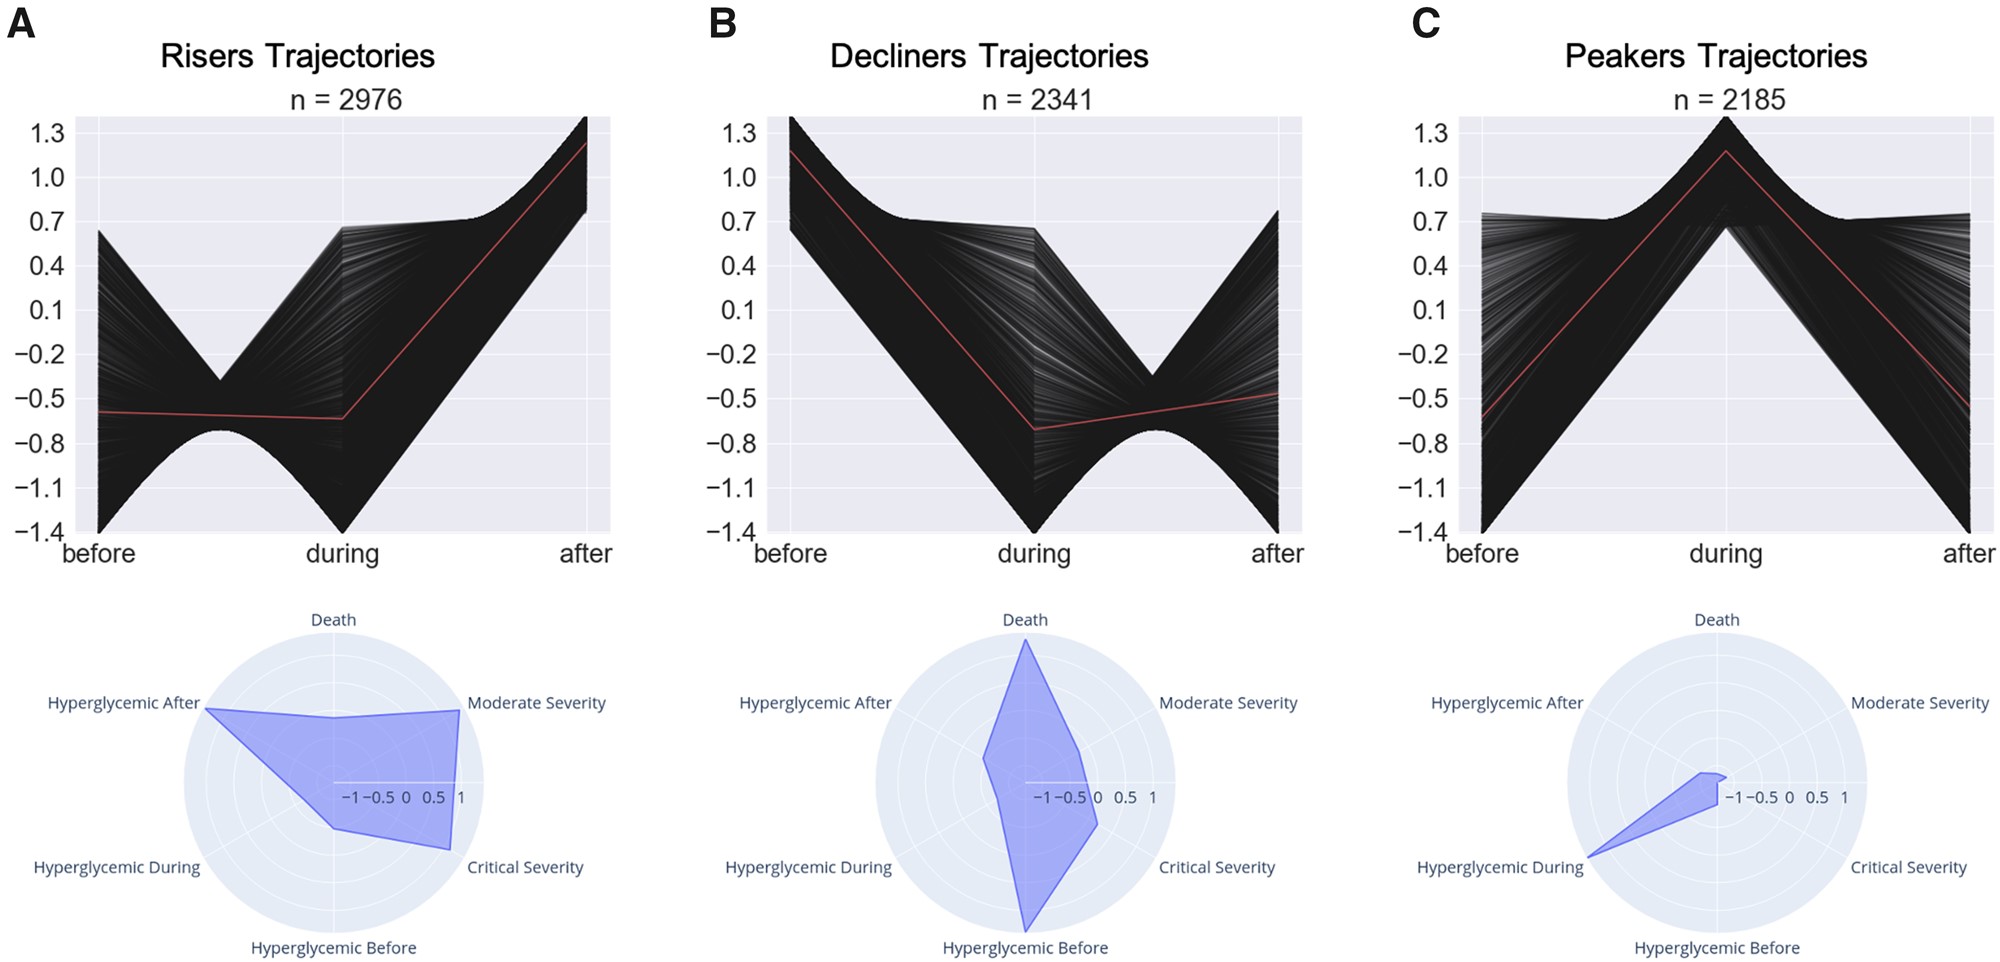
Data-Driven Identification of Temporal Glucose Patterns in a Large Cohort of Nondiabetic Patients With COVID-19 Using Time-Series Clustering
By Sejal Mistry, Ramkiran Gouripeddi, Julio C. Facelli
Department of Biomedical Informatics, Center for Clinical and Translational Science, University of Utah
Objective:
Hyperglycemia has emerged as an important clinical manifestation of coronavirus disease 2019 (COVID-19) in diabetic and nondiabetic patients. Whether these glycemic changes are specific to a subgroup of patients and persist following COVID-19 resolution remains to be elucidated. This work aimed to characterize longitudinal random blood glucose in nondiabetic patients diagnosed with COVID-19.
Materials and Methods:
De-identified electronic medical records of 7,502 patients diagnosed with COVID-19 without prior diagnosis of diabetes between January 1, 2020, and November 18, 2020, were accessed through the TriNetX Research Network. Time-series clustering algorithms were trained to identify distinct clusters of glucose trajectories.
Results:
Time-series clustering identified a low-complexity model with 3 clusters and a high-complexity model with 19 clusters as the best-performing models. In both models, cluster membership differed significantly by death status, COVID-19 severity, and glucose levels. Clusters membership in the 19 cluster model also differed significantly by age, sex, and new-onset diabetes mellitus.
Discussion and Conclusion:
This work identified distinct longitudinal blood glucose changes associated with subclinical glucose dysfunction in the low-complexity model and increased new-onset diabetes incidence in the high-complexity model. Together, these findings highlight the utility of data-driven techniques to elucidate longitudinal glycemic dysfunction in patients with COVID-19 and provide clinical evidence for further evaluation of the role of COVID-19 in diabetes pathogenesis.
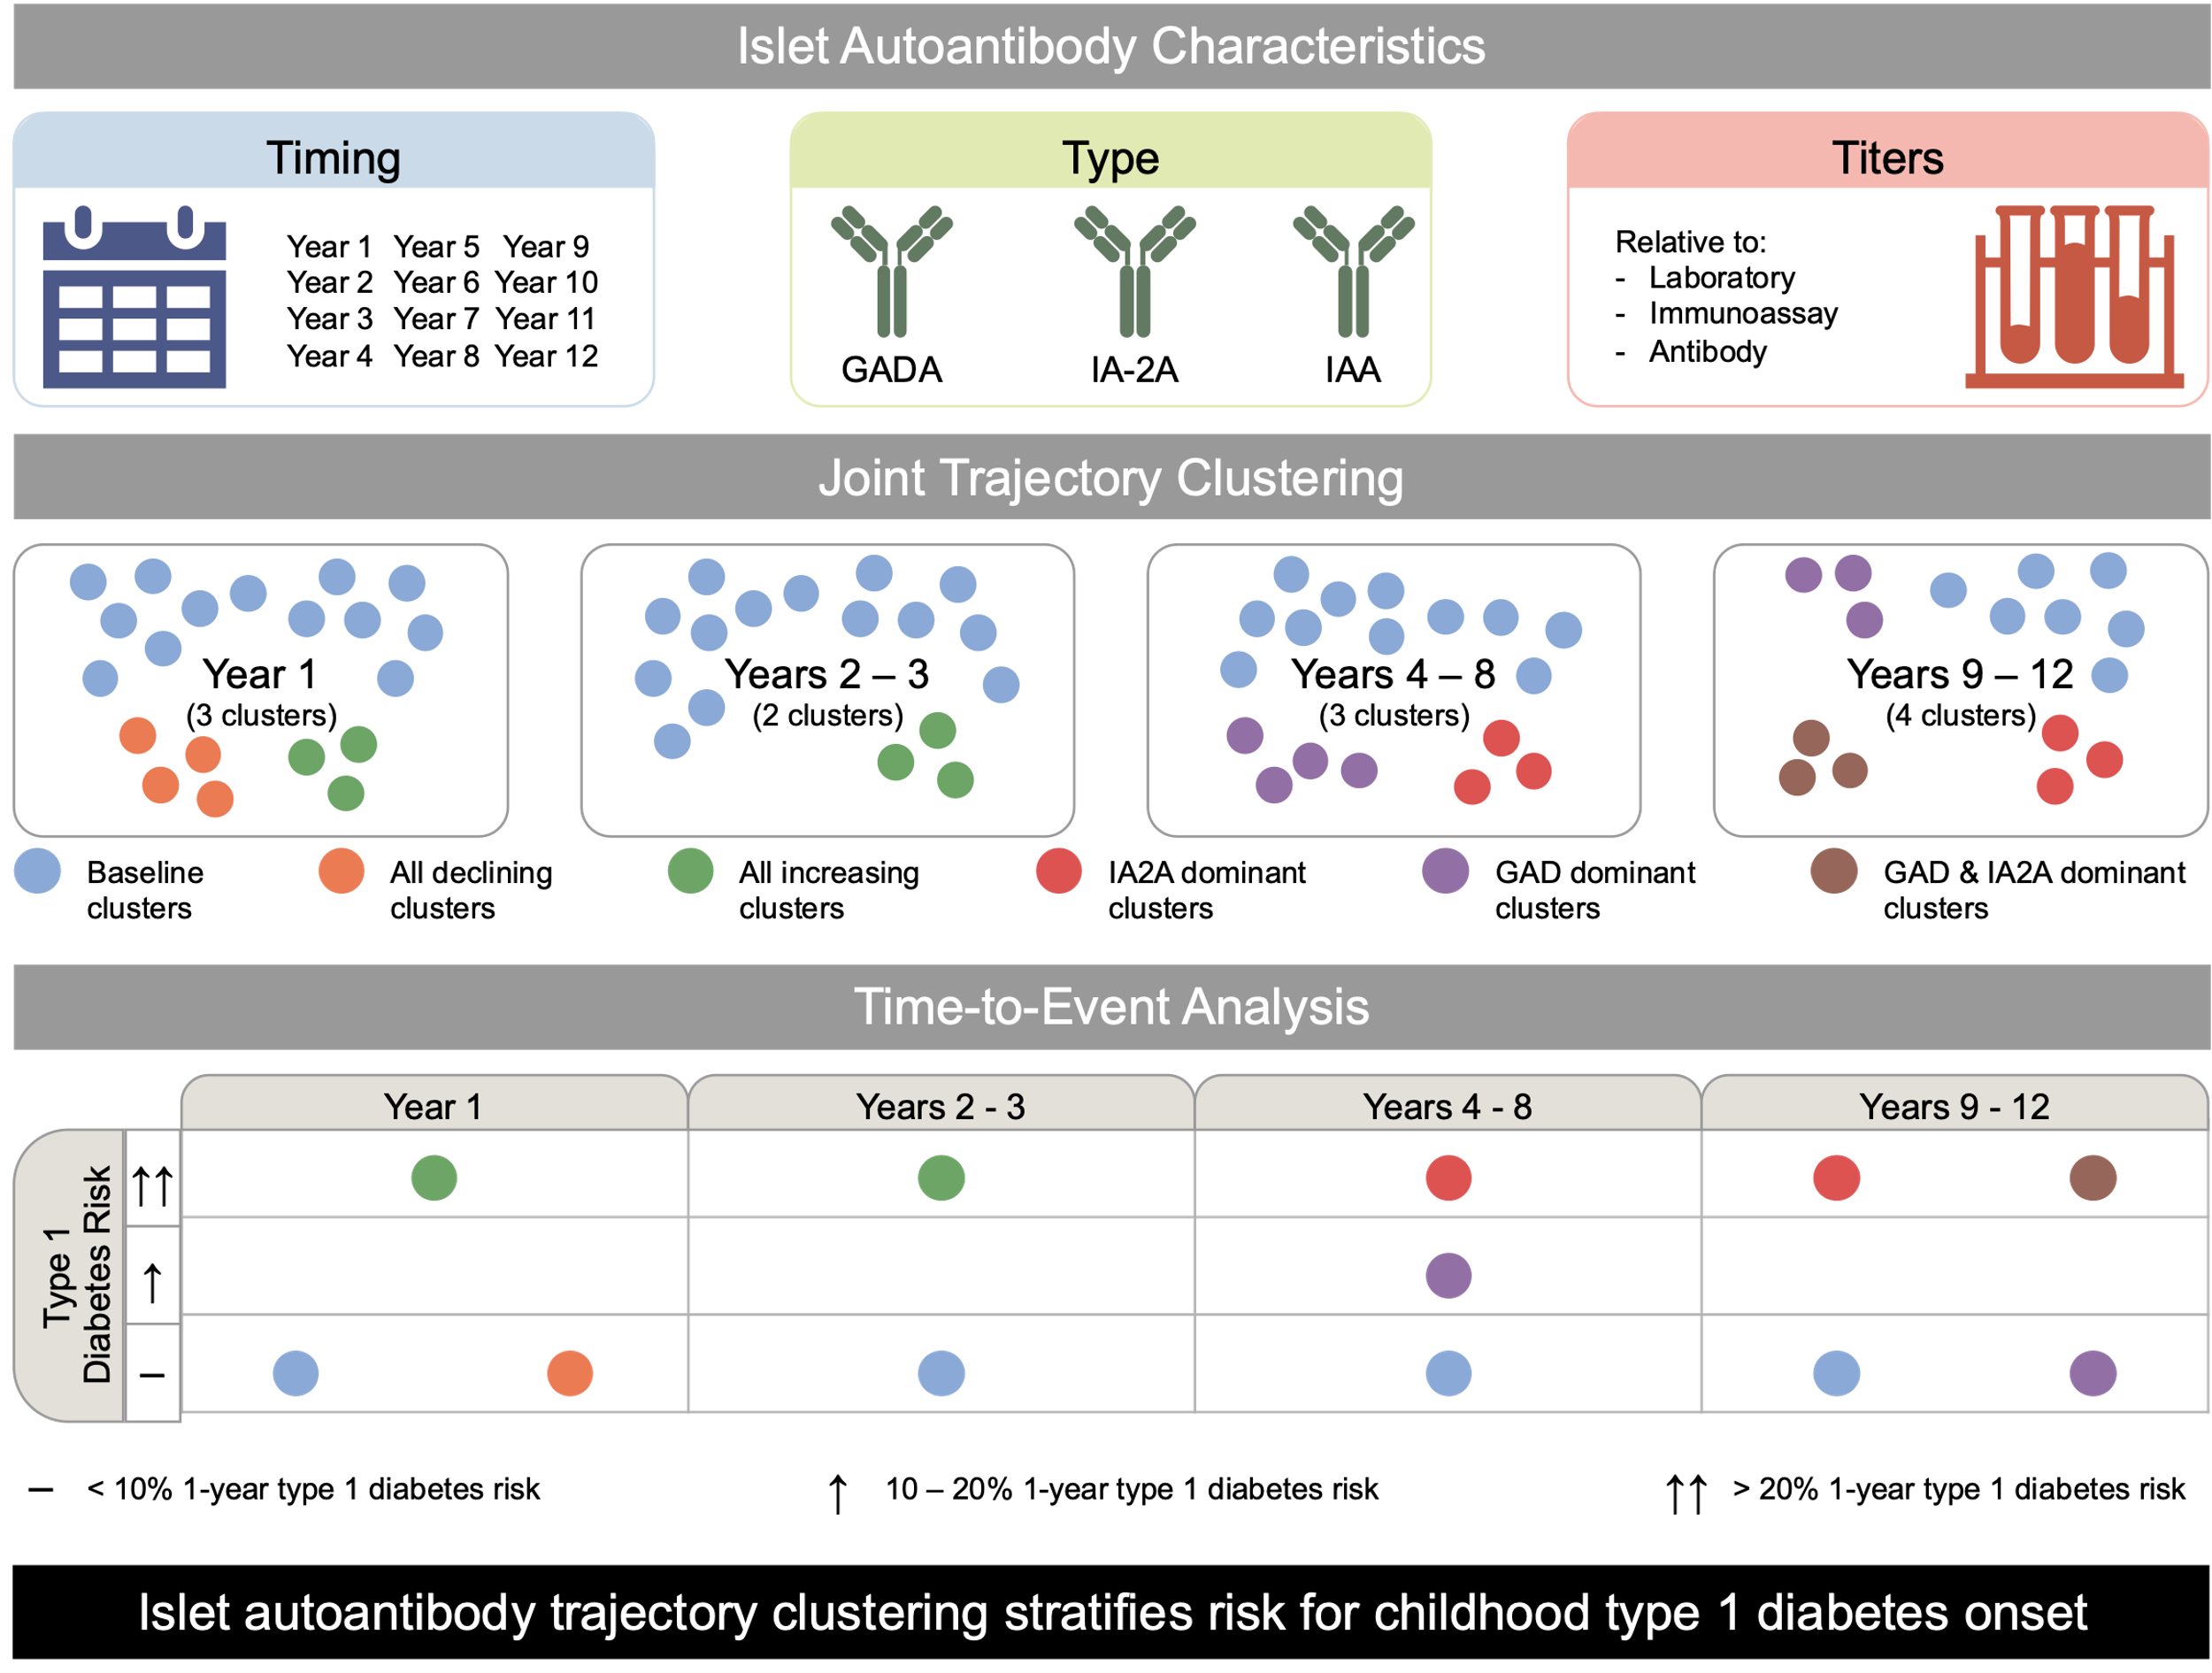
Stratifying Risk for Onset of Type 1 Diabetes Using Islet Autoantibody Trajectory Clustering
By Sejal Mistry, Ramkiran Gouripeddi, Vandana Raman, Julio C. Facelli
Department of Biomedical Informatics, Center for Clinical and Translational Science, Division of Pediatric Endocrinology, Department of Pediatrics University of Utah
Aims/Hypothesis:
Islet autoantibodies can be detected prior to the onset of type 1 diabetes and are important tools for disease screening. Current risk models rely on positivity status of islet autoantibodies alone. This work aimed to determine if a data-driven model incorporating characteristics of islet autoantibody development, including timing, type, and titer, could stratify risk for type 1 diabetes onset.
Methods:
Glutamic acid decarboxylase (GADA), tyrosine phosphatase islet antigen-2 (IA-2A), and insulin (IAA) islet autoantibodies were obtained for 1,415 children enrolled in The Environmental Determinants of Diabetes in the Young study. Unsupervised machine learning algorithms were trained to identify clusters of autoantibody development based on islet autoantibody timing, type, and titer.
Results:
We identified 2 – 4 clusters in each year cohort that differed by autoantibody timing, titer, and type. During the first 3 years of life, risk for type 1 diabetes was driven by membership in clusters with high titers of all three autoantibodies. Type 1 diabetes risk transitioned to type-specific titers during ages 4 – 8, as clusters with high titers of IA-2A showed faster progression to diabetes compared to high titers of GADA. The importance of high GADA titers decreased during ages 9 – 12, with clusters containing high titers of IA-2A alone or both GADA and IA-2A demonstrating increased risk.
Conclusions/Interpretation:
This unsupervised machine learning approach provides a novel tool for stratifying type 1 diabetes risk using multiple autoantibody characteristics. Overall, this work supports incorporation of islet autoantibody timing, type, and titer in risk stratification models for etiologic studies, prevention trials, and disease screening.
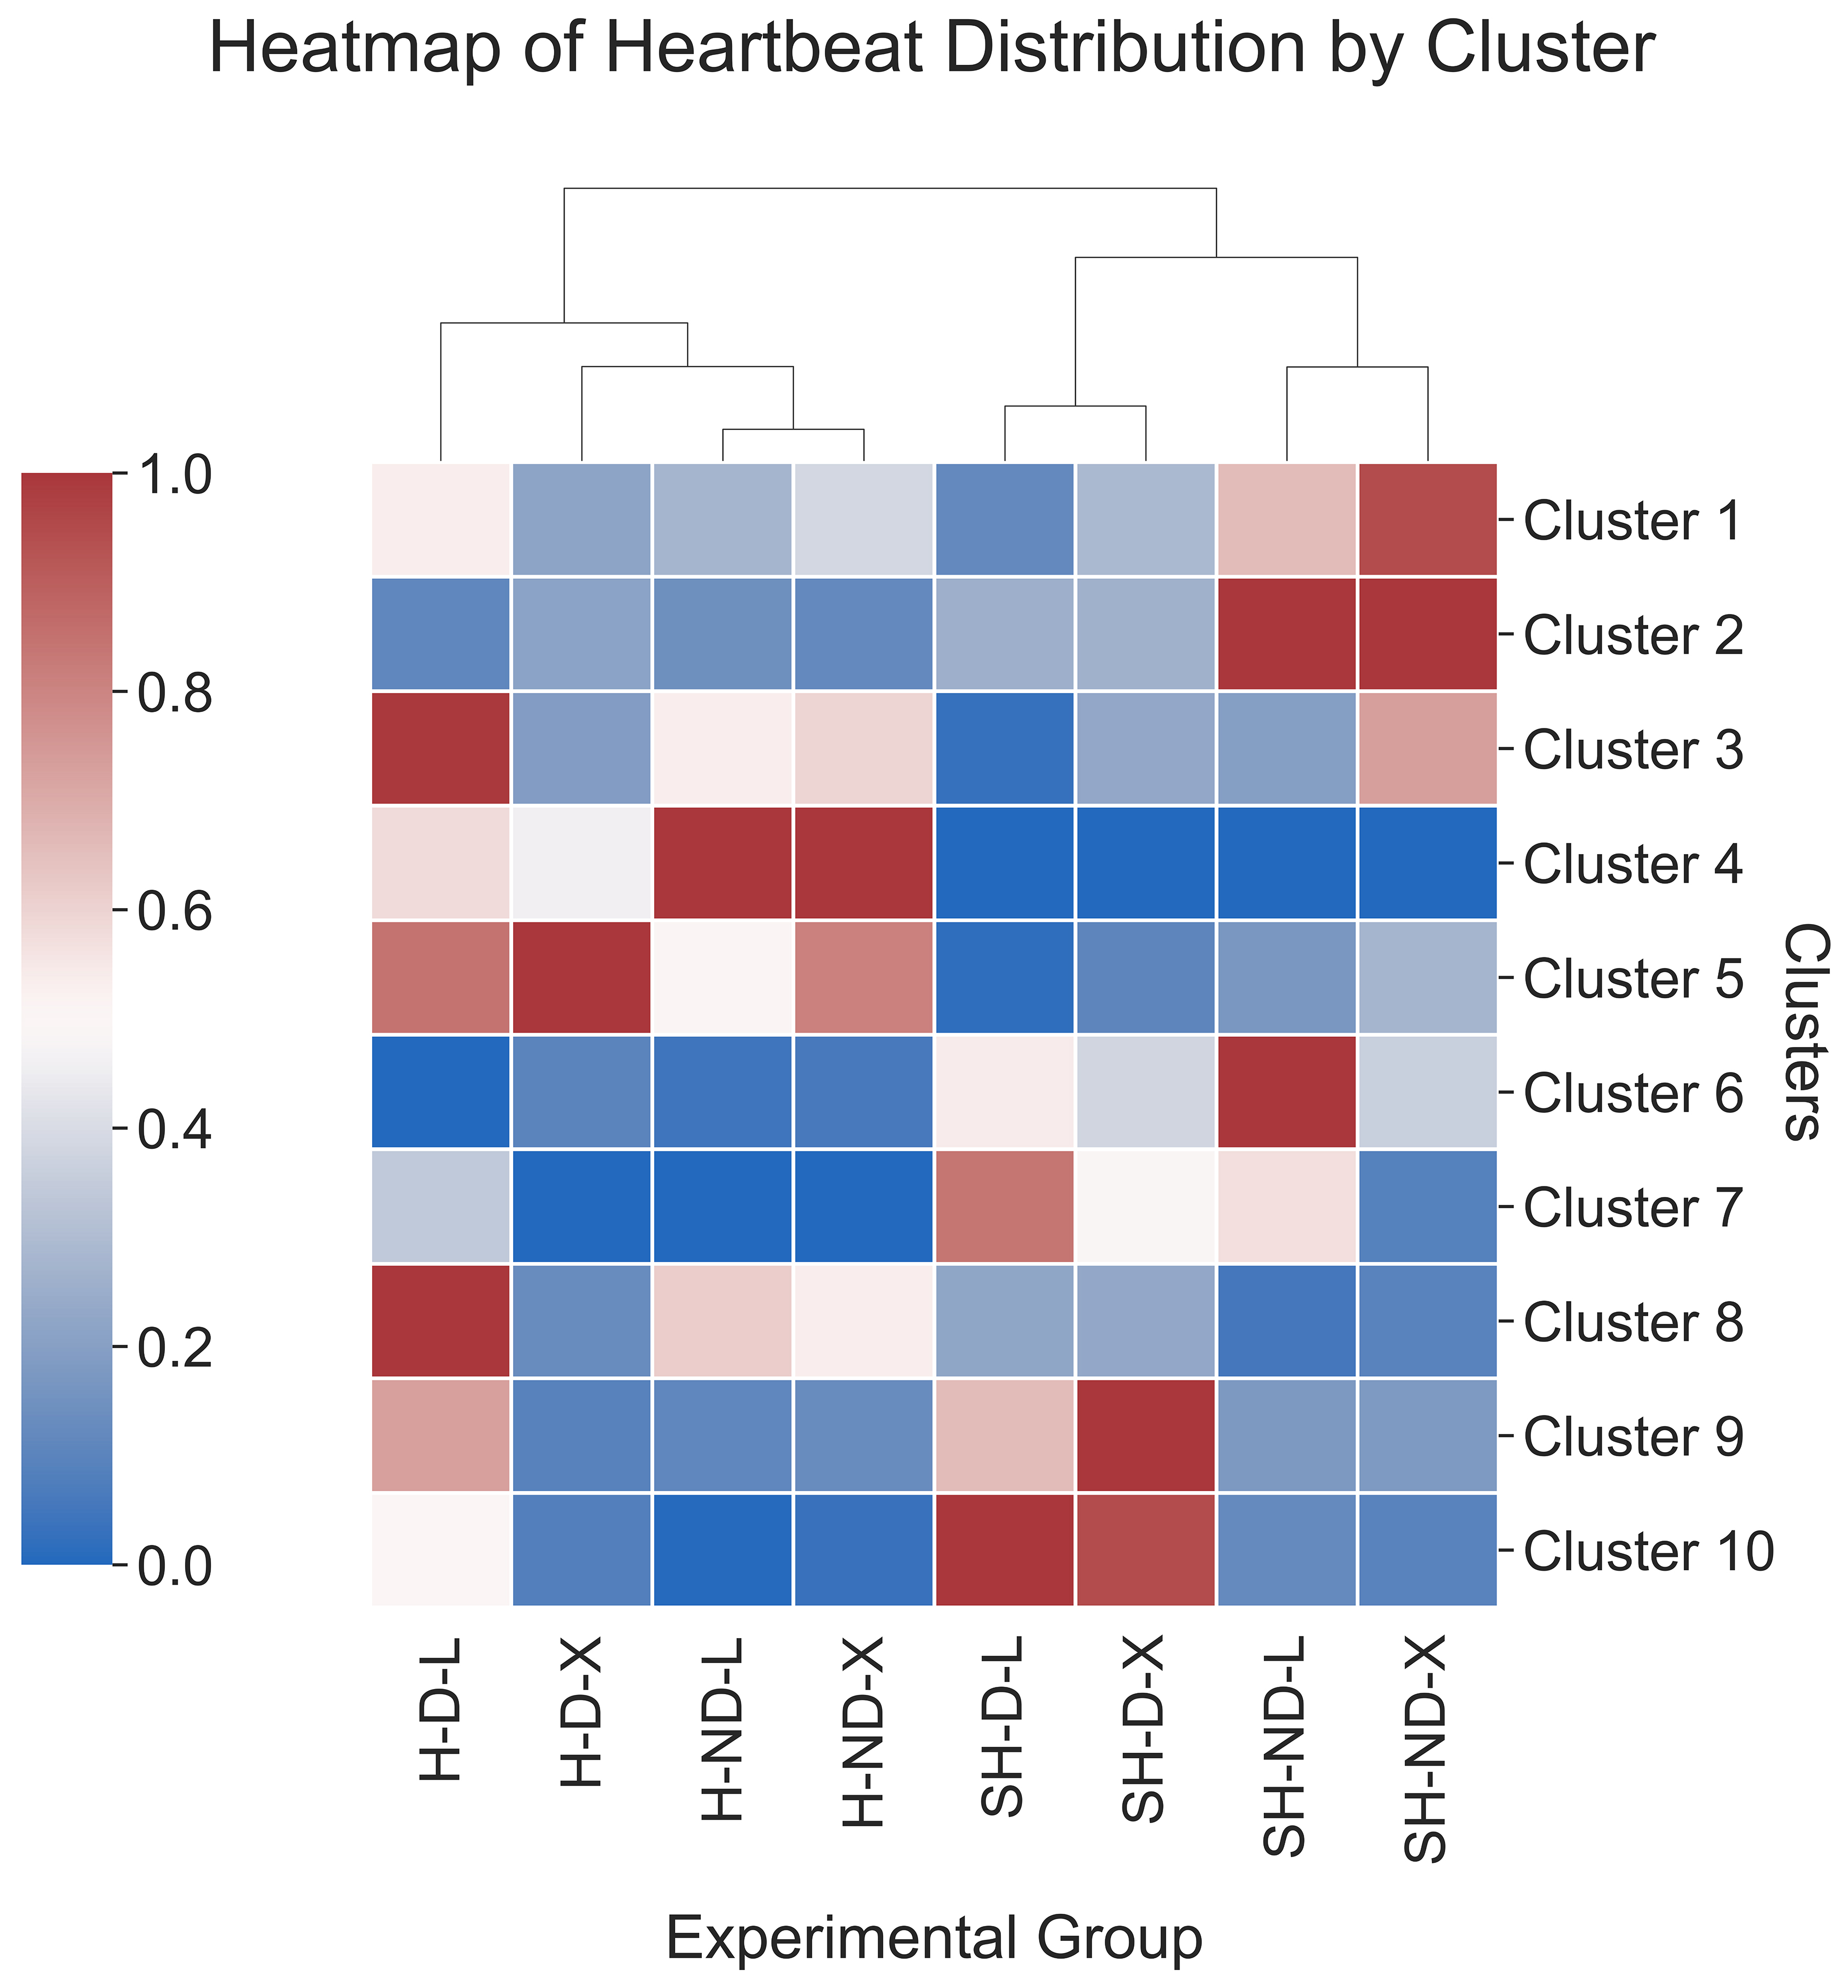
Detecting Hypoglycemia-Induced Electrocardiogram Changes in a Rodent Model of Type 1 Diabetes Using Shape-Based Clustering
By Sejal Mistry, Ramkiran Gouripeddi, Candace M. Reno, Samir Abdelrahman, Simon J. Fisher, Julio C. Facelli
Department of Biomedical Informatics, Center for Clinical and Translational Science, Department of Internal Medicine, University of Utah
Division of Endocrinology, Diabetes, and Metabolism, Department of Internal Medicine, University of Kentucky
Sudden death related to hypoglycemia is thought to be due to cardiac arrhythmias, and a clearer understanding of the cardiac changes associated with hypoglycemia-induced mortality are needed to reduce mortality. The objective of this work was to identify distinct patterns of electrocardiogram heartbeat changes that correlated with glycemic level, diabetes status, and mortality using a rodent model. Electrocardiogram and glucose measurements were collected from 54 diabetic and 37 non-diabetic rats undergoing insulin-induced hypoglycemic clamps. Shape-based unsupervised clustering was performed to identify distinct clusters of electrocardiogram heartbeats and clustering performance was assessed using internal evaluation metrics. Phenotypic features of diabetes, death, hypoglycemia, severe hypoglycemia, PR interval, and QT interval were calculated for each identified cluster. Overall, 10 clusters of ECG heartbeats were identified using shape-based unsupervised clustering. Cluster differed by heartbeat morphology, diabetes status, and glycemic level. Clusters 7, 9, and 10 were more common among diabetic rats during severe hypoglycemia. While Clusters 7 and 10 demonstrated a combination of PR prolongation and QT prolongation, Cluster 9 demonstrated an arrhythmogenic waveform and was more common among diabetic rats during severe hypoglycemia that died. Overall, this study provides the first data-driven characterization of ECG heartbeats in a rodent model of diabetes during hypoglycemia.
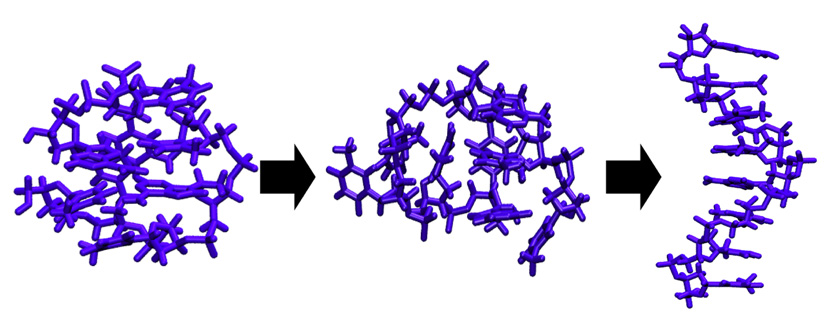
Structures and Dynamics of DNA Mini-Dumbbells are Force Field Dependent
By Lauren Winkler, Rodrigo Galindo-Murillo, Thomas E. Cheatham III.
Department of Medicinal Chemistry, College of Pharmacy, University of Utah
Resources from the Center for High Performance Computing were used to evaluate the influence of chosen force fields on Molecular Dynamics (MD) simulations of non-duplex DNA structures.
Flexible nucleic acid structures can be challenging to accurately resolve with currently available experimental structural determination techniques. MD simulations can be implemented to complement experimental techniques and have shown great success in modeling duplex DNA structures. Currently, noncanonical (non-duplex) structures have proven quite challenging to accurately replicate with respect to experimental structures. These structures are more sensitive to the balances of inter- and intra- molecular forces including charge interactions, hydrogen bonding, stacking contacts, and backbone flexibility, to name a few. In simulations, the forces are represented as “force fields” and small differences between force fields can lead to large differences in the simulations. In this work, currently available nucleic acid force fields are evaluated using a flexible, yet stable model system: the DNA mini-dumbbell. Prior to MD simulations, NMR re-refinement was accomplished using improved refinement techniques in explicit solvent to yield DNA mini-dumbbell structures that better agree with each other among the newly determined PDB snapshots, with the NMR data itself, as well as the unrestrained simulation data. Starting from newly determined structures, a total aggregate of over 800 µs of production data between 2 DNA mini-dumbbell sequences and 8 force fields was collected to compare to these newly refined structures. The force fields tested spanned from traditional Amber force fields: bsc0, bsc1, OL15, and OL21; to Charmm force fields: Charmm36 and the Drude polarizable force field; as well as force fields from independent developers: Tumuc1 and CuFix/NBFix. The results indicated slight variations not only between the different force fields, but also between the sequences. Surprisingly, many of the recently developed force fields generated structures in good agreement with experiments. Yet, each of the force fields provided a different distribution of potentially anomalous structures.
To find out more about this project, read the paper in the Journal of Computation and Theoretical Chemistry.
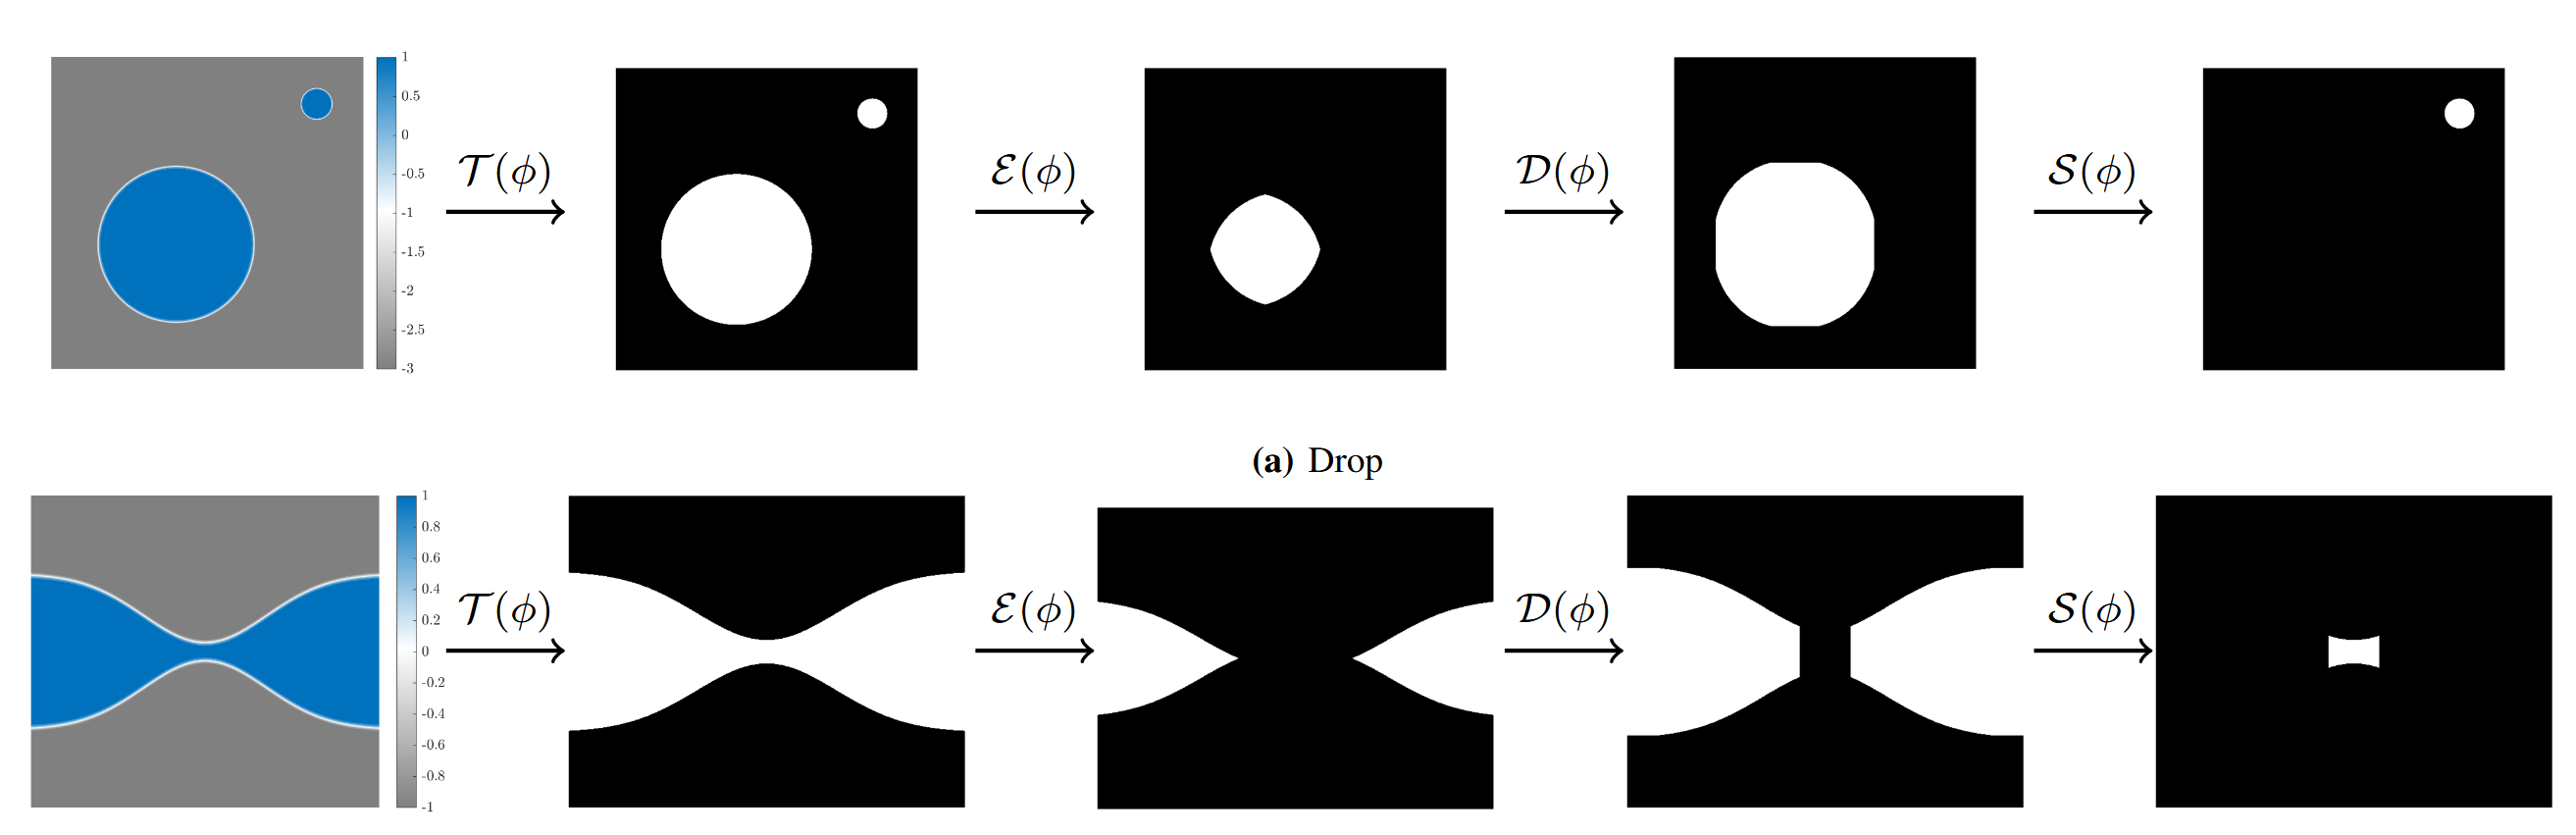
Scalable Adaptive Algorithms for Next-Generation Multiphase Flow Simulations
By Masado Ishii, Hari Sundar, Kumar Saurabh, Makrand Khanwale, Baskar Ganapathysubramian
University of Utah, Iowa State University
Multiphase flows -- more specifically, two-phase flows, where one fluid interacts with another fluid and are ubiquitous in natural and engineered systems. Examples include natural phenomena from breaking waves and cloud formation to engineering applications like printing, additive manufacturing, and all types of spraying operations in healthcare and agriculture. High-fidelity modeling of two-phase flows has been an indispensable strategy for understanding, designing, and controlling such phenomena, however this is difficult due to the wide range of spatial and temporal scales, especially under turbulent conditions.
We have developed scalable algorithms to identify the spatial regions of interest in the computational domain where the flow features become comparable to the mesh resolution, i.e., regions where ϵ/r~O(1). This was essential for phenomena exhibiting droplets and fluid filaments, where such targeted resolution is critical for performing cost-effective simulation physics. We also developed octree refinement and coarsening algorithms to accelerate remeshing and decrease the associated overhead, especially for multi-level refinements. This is essential for simulations where the element sizes drop substantially. For instance, in the canonical example of primary jet atomization, element sizes vary by three orders of magnitude to accurately resolve fluid features varying by nine orders of magnitude in volume. This contrasts with existing approaches, where refinement or coarsening of the octrees is done level by level.
We demonstrate the ability of our algorithm, producing one of the highest resolution datasets of primary jet atomization. Initial development and testing and validation of our methods were done on the notchpeak cluster at CHPC. The full-scale production run required over 200,000 node hours on TACC Frontera, is equivalent to 35 trillion grid points on a uniform mesh and is 64x more resolved than the current state-of-the-art simulations.